Fluke 125 Fluke 125 Users Manual - Page 59
Table 4-2. Tested Signal Properties, Property, Explanation, Table 4-3. Bus Test Screen Indicators
 |
View all Fluke 125 manuals
Add to My Manuals
Save this manual to your list of manuals |
Page 59 highlights
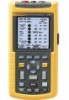
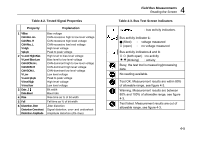
Table 4-2. Tested Signal Properties Property Explanation 1 VBias CAN-Rec. H-L CAN-Rec. H CAN-Rec. L V High Vpk-pk 2 V-Level High-Bias V-Level Bias-Low CAN-DOM. H-L CAN-DOM. H CAN-DOM. L V Low V-Level pk-pk V-level high V-level low 3 Data Data Baud 4 Rise 5 Fall 6 Distortion Jitter Distortion Overshoot Distortion Amplitude Bias voltage CAN-recessive high to low level voltage CAN-recessive high level voltage CAN-recessive low level voltage High level voltage Peak to peak voltage High level to bias level voltage Bias level to low level voltage CAN-dominant high to low level voltage CAN-dominant high level voltage CAN-dominant low level voltage Low level voltage Peak to peak voltage High level voltage Low level voltage Bit width Baud rate Rise time as % of bit width Fall time as % of bit width Jitter distortion Signal distortion, over- and undershoot Amplitude distortion (AS-i bus) 4 Field Bus Measurements Reading the Screen Table 4-3. Bus Test Screen Indicators : bus activity indicators. Bus activity indicator 1: Q (filled) : voltage measured { (open) : no voltage measured Bus activity indicators 2 and 3: { { (both open) : no activity ÑÑ(blinking) : activity Busy, the test tool is measuring/processing data. No reading available. Test OK. Measurement results are within 80% of allowable range, see figure 4-3. Warning. Measurement results are between 80% and 100% of allowable range, see figure 4-3. Test failed. Measurement results are out of allowable range, see figure 4-3. 4-5
-
 1
1 -
2
-
3
-
4
-
5
-
6
-
7
-
8
-
9
-
10
-
11
-
12
-
13
-
14
-
15
-
16
-
17
-
18
-
19
-
20
-
21
-
22
-
23
-
24
-
25
-
26
-
27
-
28
-
29
-
30
-
31
-
32
-
33
-
34
-
35
-
36
-
37
-
38
-
39
-
40
-
41
-
42
-
43
-
44
-
45
-
46
-
47
-
48
-
49
-
50
-
51
-
52
-
53
-
 54
54 -
 55
55 -
 56
56 -
 57
57 -
 58
58 -
 59
59 -
 60
60 -
 61
61 -
 62
62 -
 63
63 -
 64
64 -
65
-
66
-
67
-
68
-
69
-
70
-
71
-
72
-
73
-
74
-
75
-
76
-
77
-
78
-
79
-
80
-
81
-
82
-
83
-
84
-
85
-
86
-
87
-
88
-
89
-
90
-
91
-
92
-
93
-
94
-
95
-
96
-
97
-
98
-
99
-
100
-
101
-
102
-
103
-
104
-
105
-
106
-
107
-
108
-
109
-
110
-
111
-
112
-
113
 |
 |