Ricoh R4 User Guide - Page 28
Histogram
 |
View all Ricoh R4 manuals
Add to My Manuals
Save this manual to your list of manuals |
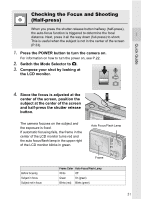
Page 28 highlights
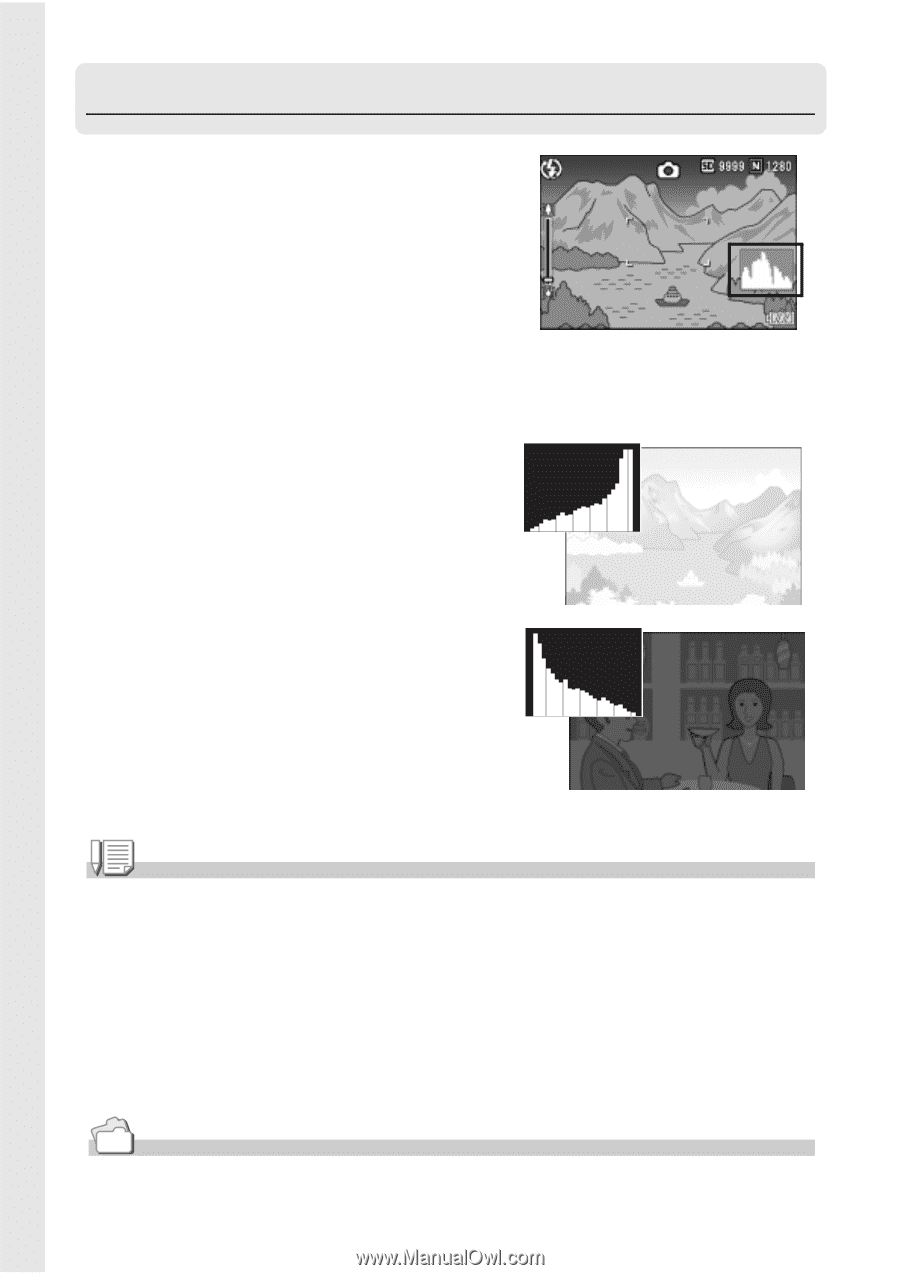
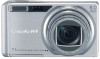
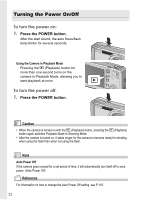
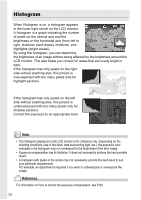
Histogram When Histogram is on, a histogram appears in the lower right corner on the LCD monitor. A histogram is a graph indicating the number of pixels on the vertical axis and the brightness on the horizontal axis (from left to right, shadows (dark areas), midtones, and highlights (bright areas)). By using the histogram, you can determine the brightness of an image without being affected by the brightness around the LCD monitor. This also helps you correct for areas that are overly bright or dark. If the histogram has only peaks on the right side without anything else, this picture is over-exposed with too many pixels only for highlight sections. If the histogram has only peaks on the left side without anything else, this picture is under-exposed with too many pixels only for shadow sections. Correct the exposure to an appropriate level. Note • The histogram displayed on the LCD monitor is for reference only. Depending on the shooting conditions (use of the flash, dark surrounding light, etc.), the exposure level indicated in the histogram may not correspond to the brightness of the shot image. • Exposure compensation has its limitation. It does not necessarily achieve the best possible result. • A histogram with peaks in the center may not necessarily provide the best result to suit your particular requirements. For example, an adjustment is required if you want to underexpose or overexpose the image. Reference For information on how to correct the exposure compensation, see P.80. 26
-
 1
1 -
2
-
3
-
4
-
5
-
6
-
7
-
8
-
9
-
10
-
11
-
12
-
13
-
14
-
15
-
16
-
17
-
18
-
19
-
20
-
21
-
22
-
 23
23 -
 24
24 -
 25
25 -
 26
26 -
 27
27 -
 28
28 -
 29
29 -
 30
30 -
 31
31 -
 32
32 -
 33
33 -
34
-
35
-
36
-
37
-
38
-
39
-
40
-
41
-
42
-
43
-
44
-
45
-
46
-
47
-
48
-
49
-
50
-
51
-
52
-
53
-
54
-
55
-
56
-
57
-
58
-
59
-
60
-
61
-
62
-
63
-
64
-
65
-
66
-
67
-
68
-
69
-
70
-
71
-
72
-
73
-
74
-
75
-
76
-
77
-
78
-
79
-
80
-
81
-
82
-
83
-
84
-
85
-
86
-
87
-
88
-
89
-
90
-
91
-
92
-
93
-
94
-
95
-
96
-
97
-
98
-
99
-
100
-
101
-
102
-
103
-
104
-
105
-
106
-
107
-
108
-
109
-
110
-
111
-
112
-
113
-
114
-
115
-
116
-
117
-
118
-
119
-
120
-
121
-
122
-
123
-
124
-
125
-
126
-
127
-
128
-
129
-
130
-
131
-
132
-
133
-
134
-
135
-
136
-
137
-
138
-
139
-
140
-
141
-
142
-
143
-
144
-
145
-
146
-
147
-
148
-
149
-
150
-
151
-
152
-
153
-
154
-
155
-
156
-
157
-
158
-
159
-
160
-
161
-
162
-
163
-
164
-
165
-
166
-
167
-
168
-
169
-
170
-
171
-
172
-
173
-
174
-
175
-
176
-
177
-
178
-
179
-
180
-
181
-
182
-
183
-
184
-
185
-
186
-
187
-
188
 |
 |