HP GbE2c HP GbE2c Ethernet Blade Switch for c-Class BladeSystem ISCLI Referenc - Page 79
NTP statistics, Uplink Failure Detection statistics, show ntp counters
 |
UPC - 808736802215
View all HP GbE2c manuals
Add to My Manuals
Save this manual to your list of manuals |
Page 79 highlights
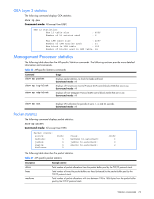
NTP statistics The following command displays NTP statistics: show ntp counters Command mode: All NTP statistics: Primary Server: Requests Sent: 17 Responses Received: 17 Updates: 1 Secondary Server: Requests Sent: 0 Responses Received: 0 Updates: 0 Last update based on response from primary server. Last update time: 18:04:16 Tue Mar 13, 2006 Current system time: 18:55:49 Tue Mar 13, 2006 The switch uses NTP (Network Timing Protocol) version 3 to synchronize the switch's internal clock with an atomic time-calibrated NTP server. With NTP enabled, the switch can accurately update its internal clock to be consistent with other devices on the network and generates accurate syslogs. The following table describes the NTP statistics: Table 72 NTP statistics Statistics Description Primary Server Secondary Server Last update based on response from primary server Last update time Current system time Requests Sent: The total number of NTP requests the switch sent to the primary NTP server to synchronize time. Responses Received: The total number of NTP responses received from the primary NTP server. Updates: The total number of times the switch updated its time based on the NTP responses received from the primary NTP server. Requests Sent: The total number of NTP requests the switch sent to the secondary NTP server to synchronize time. Responses Received: The total number of NTP responses received from the secondary NTP server. Updates: The total number of times the switch updated its time based on the NTP responses received from the secondary NTP server. Last update of time on the switch based on either primary or secondary NTP response received. The time stamp showing the time when the switch was last updated. The switch system time when the command show ntp counters was issued. Uplink Failure Detection statistics The following command allows you to display Uplink Failure Detection (UFD) statistics. show ufd counters Command mode: All Uplink Failure Detection statistics: Number of times LtM link failure: 1 Number of times LtM link in Blocking State: 0 Number of times LtD got auto disabled: 1 Statistics commands 79
-
 1
1 -
2
-
3
-
4
-
5
-
6
-
7
-
8
-
9
-
10
-
11
-
12
-
13
-
14
-
15
-
16
-
17
-
18
-
19
-
20
-
21
-
22
-
23
-
24
-
25
-
26
-
27
-
28
-
29
-
30
-
31
-
32
-
33
-
34
-
35
-
36
-
37
-
38
-
39
-
40
-
41
-
42
-
43
-
44
-
45
-
46
-
47
-
48
-
49
-
50
-
51
-
52
-
53
-
54
-
55
-
56
-
57
-
58
-
59
-
60
-
61
-
62
-
63
-
64
-
65
-
66
-
67
-
68
-
69
-
70
-
71
-
72
-
73
-
 74
74 -
 75
75 -
 76
76 -
 77
77 -
 78
78 -
 79
79 -
 80
80 -
 81
81 -
 82
82 -
 83
83 -
 84
84 -
85
-
86
-
87
-
88
-
89
-
90
-
91
-
92
-
93
-
94
-
95
-
96
-
97
-
98
-
99
-
100
-
101
-
102
-
103
-
104
-
105
-
106
-
107
-
108
-
109
-
110
-
111
-
112
-
113
-
114
-
115
-
116
-
117
-
118
-
119
-
120
-
121
-
122
-
123
-
124
-
125
-
126
-
127
-
128
-
129
-
130
-
131
-
132
-
133
-
134
-
135
-
136
-
137
-
138
-
139
-
140
-
141
-
142
-
143
-
144
-
145
-
146
-
147
-
148
-
149
-
150
-
151
-
152
-
153
 |
 |