Adobe 22011292 User Manual - Page 92
Apply the Noise Reduction effect, Noise Reduction options, Capture Noise Print
 |
UPC - 883919139081
View all Adobe 22011292 manuals
Add to My Manuals
Save this manual to your list of manuals |
Page 92 highlights
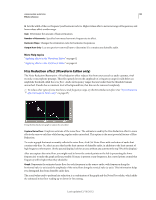
USING ADOBE AUDITION 88 Effects reference More Help topics "About process effects" on page 63 "Control effect settings with graphs" on page 61 Apply the Noise Reduction effect 1 In the Waveform Editor, select a range that contains only noise and is at least half a second long. To select noise in a specific frequency range, use the Marquee Selection tool. (See "Select spectral ranges" on page 39.) 2 Choose Effects > Noise Reduction/Restoration > Capture Noise Print. 3 In the Editor panel, select the range from which you want to remove noise. 4 Choose Effects > Noise Reduction/Restoration > Noise Reduction. 5 Set the desired options. When recording in noisy environments, record a few seconds of representative background noise that can be used as a noise print later on. Noise Reduction options Capture Noise Print Extracts a noise profile from a selected range, indicating only background noise. Adobe Audition gathers statistical information about the background noise so it can remove it from the remainder of the waveform. If the selected range is too short, Capture Noise Print is disabled. Reduce the FFT Size or select a longer range of noise. If you can't find a longer range, copy and paste the currently selected range to create one. (You can later remove the pasted noise by using the Edit > Delete command.) Save the Current Noise Print Saves the noise print as an .fft file, which contains information about sample type, FFT (Fast Fourier Transform) size, and three sets of FFT coefficients: one for the lowest amount of noise found, one for the highest amount, and one for the power average. Load a Noise Print from Disk Opens any noise print previously saved from Adobe Audition in FFT format. However, you can apply noise prints only to identical sample types. (For example, you can't apply a 22 kHz mono profile to 44kHz stereo samples.) Note: Because noise prints are so specific, a print for one type of noise won't produce good results with other types. If you regularly remove similar noise, however, a saved profile can greatly increase efficiency. Graph Depicts frequency along the x-axis (horizontal) and the amount of noise reduction along the y-axis (vertical). The blue control curve sets the amount of noise reduction in different frequency ranges. For example, if you need noise reduction only in the higher frequencies, adjust the control curve downward to the right of the graph. If you click the Reset button to flatten the control curve, the amount of noise reduction is based entirely on the noise print. To better focus on the noise floor, click the menu button Curve and Show Tooltip Over Graph. to the upper right of the graph, and deselect Show Control Noise Floor High shows the highest amplitude of detected noise at each frequency; Low shows the lowest amplitude. Threshold shows the amplitude below which noise reduction occurs. The three elements of the noise floor can overlap in the graph. To better distinguish them, click the menu button , and select options from the Show Noise Floor menu. Last updated 2/16/2012
-
 1
1 -
2
-
3
-
4
-
5
-
6
-
7
-
8
-
9
-
10
-
11
-
12
-
13
-
14
-
15
-
16
-
17
-
18
-
19
-
20
-
21
-
22
-
23
-
24
-
25
-
26
-
27
-
28
-
29
-
30
-
31
-
32
-
33
-
34
-
35
-
36
-
37
-
38
-
39
-
40
-
41
-
42
-
43
-
44
-
45
-
46
-
47
-
48
-
49
-
50
-
51
-
52
-
53
-
54
-
55
-
56
-
57
-
58
-
59
-
60
-
61
-
62
-
63
-
64
-
65
-
66
-
67
-
68
-
69
-
70
-
71
-
72
-
73
-
74
-
75
-
76
-
77
-
78
-
79
-
80
-
81
-
82
-
83
-
84
-
85
-
86
-
 87
87 -
 88
88 -
 89
89 -
 90
90 -
 91
91 -
 92
92 -
 93
93 -
 94
94 -
 95
95 -
 96
96 -
 97
97 -
98
-
99
-
100
-
101
-
102
-
103
-
104
-
105
-
106
-
107
-
108
-
109
-
110
-
111
-
112
-
113
-
114
-
115
-
116
-
117
-
118
-
119
-
120
-
121
-
122
-
123
-
124
-
125
-
126
-
127
-
128
-
129
-
130
-
131
-
132
-
133
-
134
-
135
-
136
-
137
-
138
-
139
-
140
-
141
-
142
-
143
-
144
-
145
-
146
-
147
 |
 |
