Adobe 22011292 User Manual - Page 96
Hiss Reduction effect (Waveform Editor only), Noise Reduction, effect Waveform Editor only
 |
UPC - 883919139081
View all Adobe 22011292 manuals
Add to My Manuals
Save this manual to your list of manuals |
Page 96 highlights
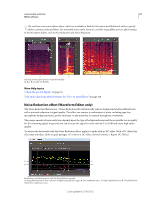
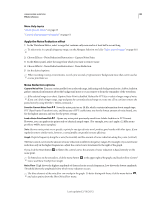
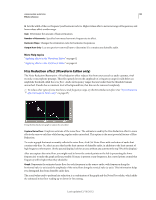
USING ADOBE AUDITION 92 Effects reference Q Sets the width of the root frequency and harmonics above. Higher values affect a narrower range of frequencies, and lower values affect a wider range. Gain Determines the amount of hum attenuation. Number of Harmonics Specifies how many harmonic frequencies to affect. Harmonic Slope Changes the attenuation ratio for harmonic frequencies. Output Hum Only Lets you preview removed hum to determine if it contains any desirable audio. More Help topics "Applying effects in the Waveform Editor" on page 62 "Applying effects in the Multitrack Editor" on page 63 Hiss Reduction effect (Waveform Editor only) The Noise Reduction/Restoration > Hiss Reduction effect reduces hiss from sources such as audio cassettes, vinyl records, or microphone preamps. This effect greatly lowers the amplitude of a frequency range if it falls below an amplitude threshold called the noise floor. Audio in frequency ranges that are louder than the threshold remain untouched. If audio has a consistent level of background hiss, that hiss can be removed completely. To reduce other types of noise that have a wide frequency range, try the Noise Reduction effect. (See "Noise Reduction effect (Waveform Editor only)" on page 87.) Using the Hiss Reduction graph to adjust the noise floor Capture Noise Floor Graphs an estimate of the noise floor. The estimate is used by the Hiss Reduction effect to more effectively remove only hiss while leaving regular audio untouched. This option is the most powerful feature of Hiss Reduction. To create a graph that most accurately reflects the noise floor, click Get Noise Floor with a selection of audio that contains only hiss. Or, select an area that has the least amount of desirable audio, in addition to the least amount of high frequency information. (In the spectral display, look for an area without any activity in the top 75% of the display.) After you capture the noise floor, you might need to lower the control points on the left (representing the lower frequencies) to make the graph as flat as possible. If music is present at any frequency, the control points around that frequency will be higher than they should be. Graph Represents the estimated noise floor for each frequency in the source audio, with frequency along the horizontal ruler (x-axis) and the amplitude of the noise floor along the vertical ruler (y-axis). This information helps you distinguish hiss from desirable audio data. The actual value used to perform hiss reduction is a combination of the graph and the Noise Floor slider, which shifts the estimated noise floor reading up or down for fine tuning. Last updated 2/16/2012
-
 1
1 -
2
-
3
-
4
-
5
-
6
-
7
-
8
-
9
-
10
-
11
-
12
-
13
-
14
-
15
-
16
-
17
-
18
-
19
-
20
-
21
-
22
-
23
-
24
-
25
-
26
-
27
-
28
-
29
-
30
-
31
-
32
-
33
-
34
-
35
-
36
-
37
-
38
-
39
-
40
-
41
-
42
-
43
-
44
-
45
-
46
-
47
-
48
-
49
-
50
-
51
-
52
-
53
-
54
-
55
-
56
-
57
-
58
-
59
-
60
-
61
-
62
-
63
-
64
-
65
-
66
-
67
-
68
-
69
-
70
-
71
-
72
-
73
-
74
-
75
-
76
-
77
-
78
-
79
-
80
-
81
-
82
-
83
-
84
-
85
-
86
-
87
-
88
-
89
-
90
-
 91
91 -
 92
92 -
 93
93 -
 94
94 -
 95
95 -
 96
96 -
 97
97 -
 98
98 -
 99
99 -
 100
100 -
 101
101 -
102
-
103
-
104
-
105
-
106
-
107
-
108
-
109
-
110
-
111
-
112
-
113
-
114
-
115
-
116
-
117
-
118
-
119
-
120
-
121
-
122
-
123
-
124
-
125
-
126
-
127
-
128
-
129
-
130
-
131
-
132
-
133
-
134
-
135
-
136
-
137
-
138
-
139
-
140
-
141
-
142
-
143
-
144
-
145
-
146
-
147
 |
 |
