Adobe 22011292 User Manual - Page 97
Output Hiss Only, Spectral Decay Rate
 |
UPC - 883919139081
View all Adobe 22011292 manuals
Add to My Manuals
Save this manual to your list of manuals |
Page 97 highlights
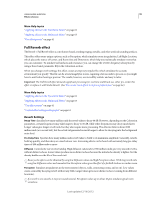
USING ADOBE AUDITION 93 Effects reference To disable tooltips for frequency and amplitude, click the menu button deselect Show Tooltip Over Graph. to the upper right of the graph, and Scale Determines how frequencies are arranged along the horizontal x-axis: • For finer control over low frequencies, select Logarithmic. A logarithmic scale more closely resembles how people hear sound. • For detailed, high-frequency work with evenly spaced intervals in frequency, select Linear. Channel Displays the selected audio channel in the graph. Reset Resets the estimated noise floor. To reset the floor higher or lower, click the menu button right of the graph, and choose an option from the Reset Control Curve menu. to the upper For quick, general-purpose hiss reduction, a complete noise floor graph isn't always necessary. In many cases, you can simply reset the graph to an even level and manipulate the Noise Floor slider. Noise Floor Fine-tunes the noise floor until the appropriate level of hiss reduction and quality is achieved. Reduce By Sets the level of hiss reduction for audio below the noise floor. With higher values (especially above 20 dB) dramatic hiss reduction can be achieved, but the remaining audio might become distorted. With lower values, not as much noise is removed, and the original audio signal stays relatively undisturbed. Output Hiss Only Lets you preview only hiss to determine if the effect is removing any desirable audio. Advanced settings Click the triangle to display these options: • Spectral Decay Rate When audio is encountered above the estimated noise floor, determines how much audio in surrounding frequencies is assumed to follow. With low values, less audio is assumed to follow, and hiss reduction will cut more closely to the frequencies being kept. Values of 40% to 75% work best. If the value is too high (above 90%), unnaturally long tails and reverbs might be heard. If the value is too low, background bubbly effects might be heard, and music might sound artificial. • Precision Factor Determines the time-accuracy of hiss reduction. Typical values range from 7 to 14. Lower values might result in a few milliseconds of hiss before and after louder parts of audio. Larger values generally produce better results and slower processing speeds. Values over 20 don't ordinarily improve quality any further. • Transition Width Produces a slow transition in hiss reduction instead of an abrupt change. Values from 5 to 10 usually achieve good results. If the value is too high, some hiss may remain after processing. If the value is too low, background artifacts might be heard. • FFT Size Specifies a Fast Fourier Transform size, which determines the tradeoff between frequency- and timeaccuracy. In general, sizes from 2048 to 8192 work best. Lower FFT sizes (2048 and below) result in better time response (less swooshing before cymbal hits, for example), but they can produce poorer frequency resolution, creating hollow or flanged sounds. Higher FFT sizes (8192 and above) might cause swooshing, reverb, and drawn out background tones, but they produce very accurate frequency resolution. • Control Points Specifies the number of points added to the graph when you click Capture Noise Floor. More Help topics "About process effects" on page 63 "Apply individual effects in the Waveform Editor" on page 62 Last updated 2/16/2012
-
 1
1 -
2
-
3
-
4
-
5
-
6
-
7
-
8
-
9
-
10
-
11
-
12
-
13
-
14
-
15
-
16
-
17
-
18
-
19
-
20
-
21
-
22
-
23
-
24
-
25
-
26
-
27
-
28
-
29
-
30
-
31
-
32
-
33
-
34
-
35
-
36
-
37
-
38
-
39
-
40
-
41
-
42
-
43
-
44
-
45
-
46
-
47
-
48
-
49
-
50
-
51
-
52
-
53
-
54
-
55
-
56
-
57
-
58
-
59
-
60
-
61
-
62
-
63
-
64
-
65
-
66
-
67
-
68
-
69
-
70
-
71
-
72
-
73
-
74
-
75
-
76
-
77
-
78
-
79
-
80
-
81
-
82
-
83
-
84
-
85
-
86
-
87
-
88
-
89
-
90
-
91
-
 92
92 -
 93
93 -
 94
94 -
 95
95 -
 96
96 -
 97
97 -
 98
98 -
 99
99 -
 100
100 -
 101
101 -
 102
102 -
103
-
104
-
105
-
106
-
107
-
108
-
109
-
110
-
111
-
112
-
113
-
114
-
115
-
116
-
117
-
118
-
119
-
120
-
121
-
122
-
123
-
124
-
125
-
126
-
127
-
128
-
129
-
130
-
131
-
132
-
133
-
134
-
135
-
136
-
137
-
138
-
139
-
140
-
141
-
142
-
143
-
144
-
145
-
146
-
147
 |
 |
