Fluke 199C/S FE 192,196,199 C Users Manual - Page 30
Waveform, Mathematics, Function: Spectrum, Window: Auto, Hanning, Spectrum measurement
 |
View all Fluke 199C/S manuals
Add to My Manuals
Save this manual to your list of manuals |
Page 30 highlights
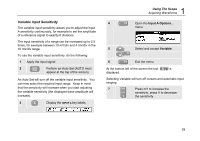
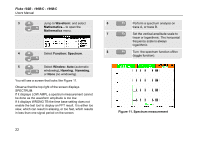
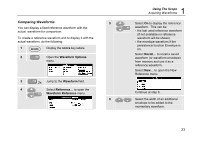
Fluke 192B - 196B/C - 199B/C Users Manual 3 Jump to Waveform: and select Mathematics... to open the Mathematics menu. 4 Select Function: Spectrum. 5 Select Window: Auto (automatic windowing), Hanning, Hamming, or None (no windowing). You will see a screen that looks like Figure 11. Observe that the top right of the screen displays SPECTRUM. If it displays LOW AMPL a spectrum measurement cannot be done as the waveform amplitude is too low. If it displays WRONG TB the time base setting does not enable the test tool to display an FFT result. It is either too slow, which can result in aliasing, or too fast, which results in less than one signal period on the screen. 6 Perform a spectrum analysis on trace A, or trace B. 7 Set the vertical amplitude scale to linear or logarithmic. The horizontal frequency scale is always logarithmic. 8 Turn the spectrum function off/on (toggle function). Figure 11. Spectrum measurement 22
-
 1
1 -
2
-
3
-
4
-
5
-
6
-
7
-
8
-
9
-
10
-
11
-
12
-
13
-
14
-
15
-
16
-
17
-
18
-
19
-
20
-
21
-
22
-
23
-
24
-
 25
25 -
 26
26 -
 27
27 -
 28
28 -
 29
29 -
 30
30 -
 31
31 -
 32
32 -
 33
33 -
 34
34 -
 35
35 -
36
-
37
-
38
-
39
-
40
-
41
-
42
-
43
-
44
-
45
-
46
-
47
-
48
-
49
-
50
-
51
-
52
-
53
-
54
-
55
-
56
-
57
-
58
-
59
-
60
-
61
-
62
-
63
-
64
-
65
-
66
-
67
-
68
-
69
-
70
-
71
-
72
-
73
-
74
-
75
-
76
-
77
-
78
-
79
-
80
-
81
-
82
-
83
-
84
-
85
-
86
-
87
-
88
-
89
-
90
-
91
-
92
-
93
-
94
-
95
-
96
-
97
-
98
-
99
-
100
-
101
-
102
-
103
-
104
-
105
-
106
-
107
-
108
-
109
-
110
-
111
-
112
-
113
-
114
-
115
-
116
-
117
-
118
-
119
-
120
-
121
-
122
 |
 |