Fluke 199C/S FE 192,196,199 C Users Manual - Page 43
Displaying Recorded Data, TrendPlot Reading
 |
View all Fluke 199C/S manuals
Add to My Manuals
Save this manual to your list of manuals |
Page 43 highlights
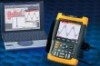
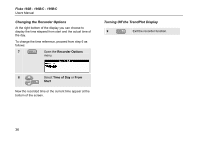
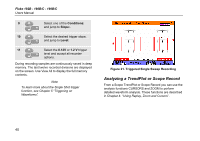
Figure 18. TrendPlot Reading When the Scope is in automatic mode, automatic vertical scaling is used to fit the TrendPlot graph on the screen. 5 Set RECORDER to STOP to freeze the recorder function. 6 Set RECORDER to RUN to restart. 3 Using The Recorder Functions Plotting Measurements Over Time (TrendPlot™) Displaying Recorded Data When in normal view (NORMAL), only the twelve most recently recorded divisions are displayed on screen. All previous recordings are stored in memory. VIEW ALL shows all data in memory: 7 Display an overview of the full waveform. Press repeatedly to toggle between normal view (NORMAL) and overview (VIEW ALL) When the recorder memory is full, an automatic compression algorithm is used to compress all samples into half of the memory without loss of transients. The other half of the recorder memory is free again to continue recording. 35
-
 1
1 -
2
-
3
-
4
-
5
-
6
-
7
-
8
-
9
-
10
-
11
-
12
-
13
-
14
-
15
-
16
-
17
-
18
-
19
-
20
-
21
-
22
-
23
-
24
-
25
-
26
-
27
-
28
-
29
-
30
-
31
-
32
-
33
-
34
-
35
-
36
-
37
-
 38
38 -
 39
39 -
 40
40 -
 41
41 -
 42
42 -
 43
43 -
 44
44 -
 45
45 -
 46
46 -
 47
47 -
 48
48 -
49
-
50
-
51
-
52
-
53
-
54
-
55
-
56
-
57
-
58
-
59
-
60
-
61
-
62
-
63
-
64
-
65
-
66
-
67
-
68
-
69
-
70
-
71
-
72
-
73
-
74
-
75
-
76
-
77
-
78
-
79
-
80
-
81
-
82
-
83
-
84
-
85
-
86
-
87
-
88
-
89
-
90
-
91
-
92
-
93
-
94
-
95
-
96
-
97
-
98
-
99
-
100
-
101
-
102
-
103
-
104
-
105
-
106
-
107
-
108
-
109
-
110
-
111
-
112
-
113
-
114
-
115
-
116
-
117
-
118
-
119
-
120
-
121
-
122
 |
 |