Fluke 199C/S FE 192,196,199 C Users Manual - Page 50
Replaying Step-by-Step, Replaying a Waveform
 |
View all Fluke 199C/S manuals
Add to My Manuals
Save this manual to your list of manuals |
Page 50 highlights
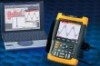
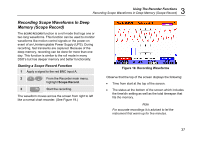
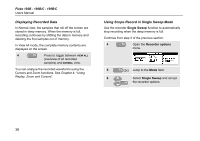
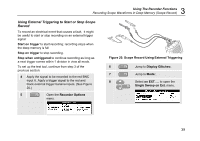
Fluke 192B - 196B/C - 199B/C Users Manual Replaying Step-by-Step To step through the last scope screens, do the following: 1 From scope mode, open the REPLAY menu. Observe that the trace is frozen and that REPLAY appears at the top of the screen (see Figure 22). 2 Step through the previous screens. 3 Step through the next screens. Observe that the bottom of the waveform area displays the replay bar with a screen number and related time stamp: Figure 22. Replaying a Waveform The replay bar represents all 100 stored screens in memory. The icon represents the picture being displayed on the screen (in this example: SCREEN -84). If the bar is partly white, the memory is not completely filled with 100 screens. From this point you can use the zoom and cursor functions to study the signal in more detail. 42
-
 1
1 -
2
-
3
-
4
-
5
-
6
-
7
-
8
-
9
-
10
-
11
-
12
-
13
-
14
-
15
-
16
-
17
-
18
-
19
-
20
-
21
-
22
-
23
-
24
-
25
-
26
-
27
-
28
-
29
-
30
-
31
-
32
-
33
-
34
-
35
-
36
-
37
-
38
-
39
-
40
-
41
-
42
-
43
-
44
-
 45
45 -
 46
46 -
 47
47 -
 48
48 -
 49
49 -
 50
50 -
 51
51 -
 52
52 -
 53
53 -
 54
54 -
 55
55 -
56
-
57
-
58
-
59
-
60
-
61
-
62
-
63
-
64
-
65
-
66
-
67
-
68
-
69
-
70
-
71
-
72
-
73
-
74
-
75
-
76
-
77
-
78
-
79
-
80
-
81
-
82
-
83
-
84
-
85
-
86
-
87
-
88
-
89
-
90
-
91
-
92
-
93
-
94
-
95
-
96
-
97
-
98
-
99
-
100
-
101
-
102
-
103
-
104
-
105
-
106
-
107
-
108
-
109
-
110
-
111
-
112
-
113
-
114
-
115
-
116
-
117
-
118
-
119
-
120
-
121
-
122
 |
 |