Fluke 199C/S FE 192,196,199 C Users Manual - Page 48
Analyzing a TrendPlot or Scope Record, Conditions, Slope, Level
 |
View all Fluke 199C/S manuals
Add to My Manuals
Save this manual to your list of manuals |
Page 48 highlights
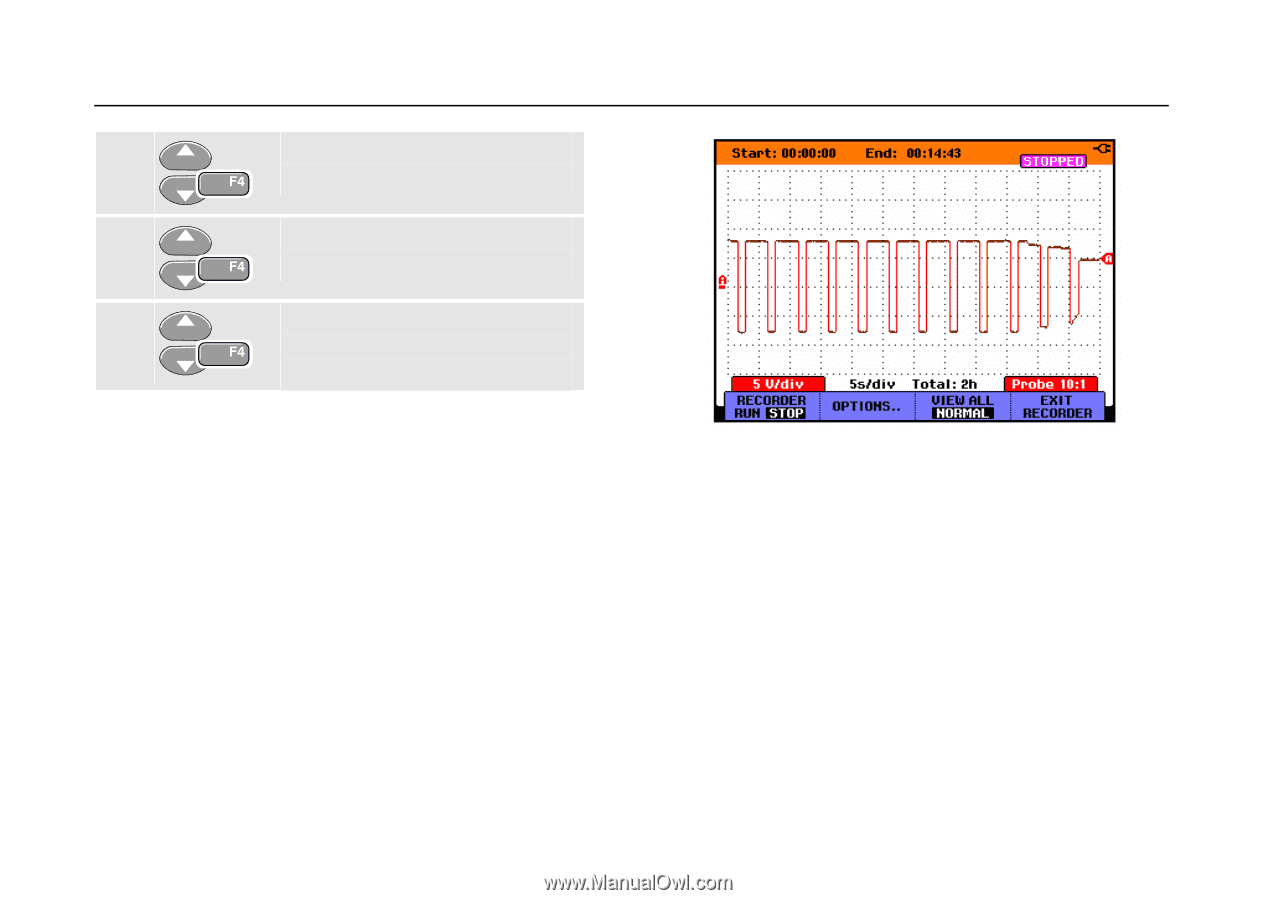
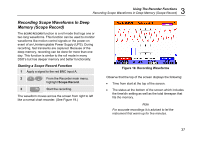
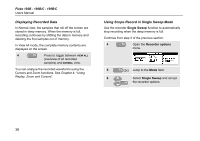
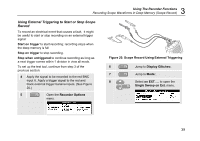
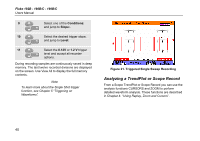
Fluke 192B - 196B/C - 199B/C Users Manual 9 Select one of the Conditions: and jump to Slope:. 10 Select the desired trigger slope, and jump to Level: 11 Select the 0.12V or 1.2 V trigger level and accept all recorder options. During recording samples are continuously saved in deep memory. The last twelve recorded divisions are displayed on the screen. Use View All to display the full memory contents. Note To learn more about the Single Shot trigger function, see Chapter 5 "Triggering on Waveforms". Figure 21. Triggered Single Sweep Recording Analyzing a TrendPlot or Scope Record From a Scope TrendPlot or Scope Record you can use the analysis functions CURSORS and ZOOM to perform detailed waveform analysis. These functions are described in Chapter 4: "Using Replay, Zoom and Cursors". 40
-
 1
1 -
2
-
3
-
4
-
5
-
6
-
7
-
8
-
9
-
10
-
11
-
12
-
13
-
14
-
15
-
16
-
17
-
18
-
19
-
20
-
21
-
22
-
23
-
24
-
25
-
26
-
27
-
28
-
29
-
30
-
31
-
32
-
33
-
34
-
35
-
36
-
37
-
38
-
39
-
40
-
41
-
42
-
 43
43 -
 44
44 -
 45
45 -
 46
46 -
 47
47 -
 48
48 -
 49
49 -
 50
50 -
 51
51 -
 52
52 -
 53
53 -
54
-
55
-
56
-
57
-
58
-
59
-
60
-
61
-
62
-
63
-
64
-
65
-
66
-
67
-
68
-
69
-
70
-
71
-
72
-
73
-
74
-
75
-
76
-
77
-
78
-
79
-
80
-
81
-
82
-
83
-
84
-
85
-
86
-
87
-
88
-
89
-
90
-
91
-
92
-
93
-
94
-
95
-
96
-
97
-
98
-
99
-
100
-
101
-
102
-
103
-
104
-
105
-
106
-
107
-
108
-
109
-
110
-
111
-
112
-
113
-
114
-
115
-
116
-
117
-
118
-
119
-
120
-
121
-
122
 |
 |