Garmin GPSMAP 298C Owner's Manual - Page 70
Hiway (Highway) Tab, Temp (Temperature) Tab, Sonar Tab, Log and Graph Scale, Log Duration - gpsmap 298 transducer
 |
UPC - 753759052072
View all Garmin GPSMAP 298C manuals
Add to My Manuals
Save this manual to your list of manuals |
Page 70 highlights
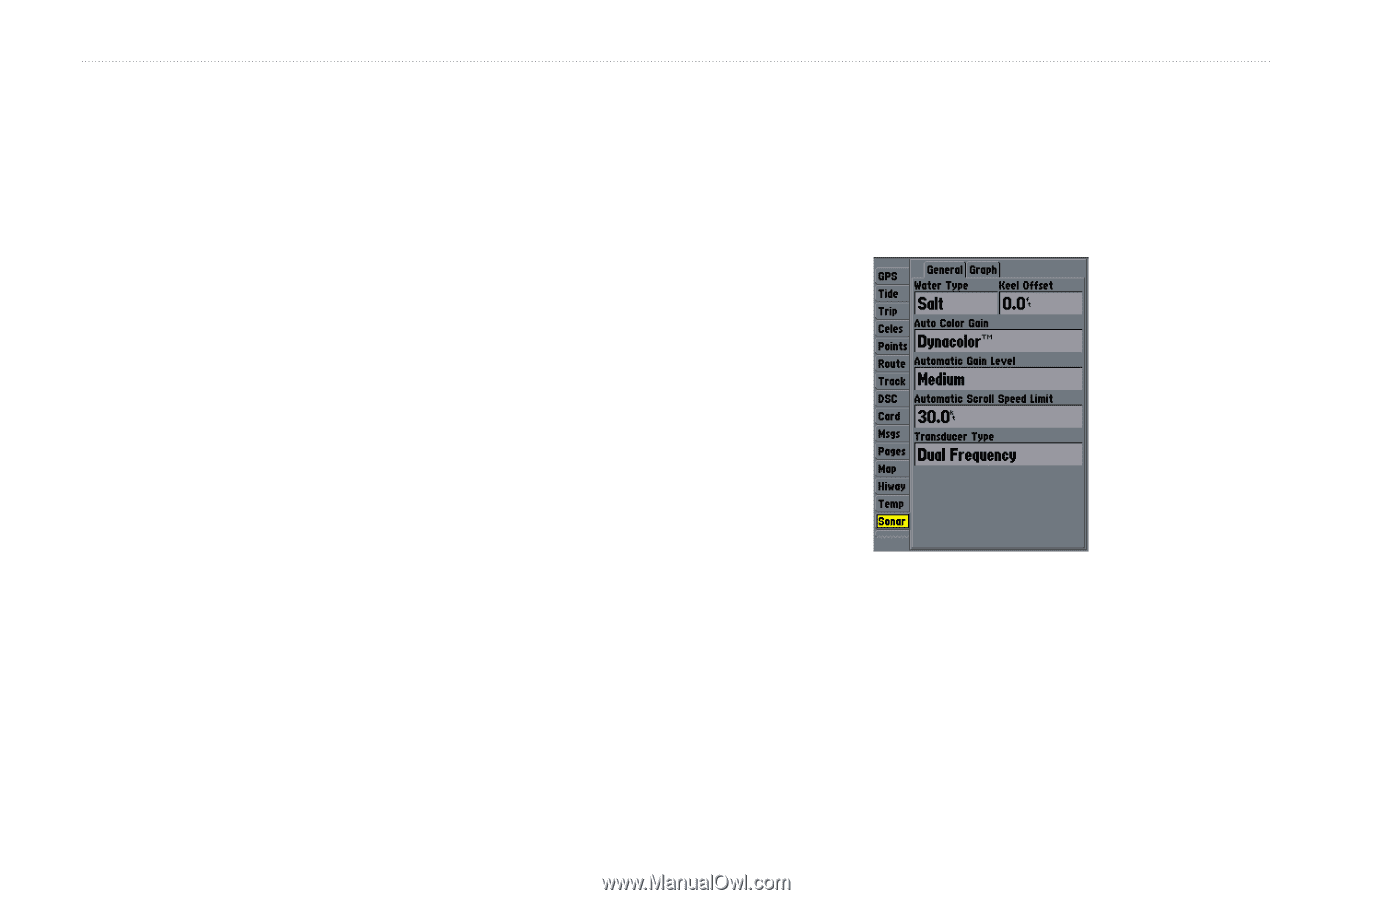
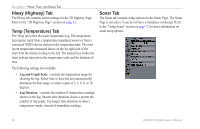
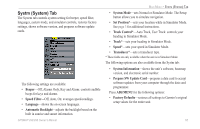
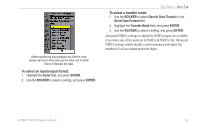
MAIN MENU > HIWAY, TEMP, AND SONAR TAB Hiway (Highway) Tab The Hiway tab contains screen settings for the 3D Highway Page. Refer to the "3D Highway Page" section on page 33. Temp (Temperature) Tab The Temp tab screen the water temperature log. The temperature log requires input from a temperature transducer/sensor or from a connected NMEA device that provides temperature data. The most recent temperature measured shows on the far right side of the chart with the history trailing to the left. The dotted lines within the chart indicate intervals in the temperature scale and the duration of time. The following settings are available: • Log and Graph Scale-controls the temperature range for showing the log. Select Auto to have the unit automatically determine the best range, or select a span of 2, 4, 6, 8, or 10 degrees. • Log Duration-controls the number of temperature readings shown on the log. Shorter time durations shows a greater the number of log points. Use longer time durations to detect temperature trends, instead of immediate readings. Sonar Tab The Sonar tab contains setup options for the Sonar Page. The Sonar Page is not active if you do not have a transducer connected. Refer to the "Using Sonar" section on page 72 for more information on sonar setup options. 64 GPSMAP 292/298 Owner's Manual
-
 1
1 -
2
-
3
-
4
-
5
-
6
-
7
-
8
-
9
-
10
-
11
-
12
-
13
-
14
-
15
-
16
-
17
-
18
-
19
-
20
-
21
-
22
-
23
-
24
-
25
-
26
-
27
-
28
-
29
-
30
-
31
-
32
-
33
-
34
-
35
-
36
-
37
-
38
-
39
-
40
-
41
-
42
-
43
-
44
-
45
-
46
-
47
-
48
-
49
-
50
-
51
-
52
-
53
-
54
-
55
-
56
-
57
-
58
-
59
-
60
-
61
-
62
-
63
-
64
-
 65
65 -
 66
66 -
 67
67 -
 68
68 -
 69
69 -
 70
70 -
 71
71 -
 72
72 -
 73
73 -
 74
74 -
 75
75 -
76
-
77
-
78
-
79
-
80
-
81
-
82
-
83
-
84
-
85
-
86
-
87
-
88
-
89
-
90
-
91
-
92
-
93
-
94
-
95
-
96
-
97
-
98
-
99
-
100
-
101
-
102
-
103
-
104
-
105
-
106
-
107
-
108
-
109
-
110
-
111
-
112
-
113
-
114
-
115
-
116
-
117
-
118
-
119
-
120
 |
 |