Garmin GPSMAP 298C Owner's Manual - Page 86
Understanding Sonar, Scale, Custom Range, Custom, Water, Temperature, Water Speed, Color Scheme
 |
UPC - 753759052072
View all Garmin GPSMAP 298C manuals
Add to My Manuals
Save this manual to your list of manuals |
Page 86 highlights
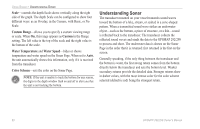
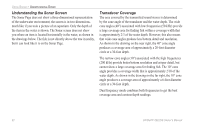
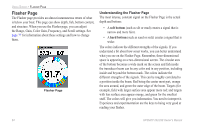
USING SONAR > UNDERSTANDING SONAR Scale-controls the depth Scale shows vertically along the right side of the graph. The depth Scale can be configured to show four different ways: as an Overlay, in the Corners, with Basic, or No Scale. Custom Range-allows you to specify a custom viewing range or scale. When On, this range appears as Custom in the Range setting. The left value is the top of the scale and the right value is the bottom of the scale. Water Temperature and Water Speed-hides or shows temperature and water speed on the Sonar Page. When set to Auto, the unit automatically shows this information, only if it is received from the transducer. Color Scheme-sets the color on the Sonar Page. NOTE: If the unit is unable to track the bottom for any reason, the digits in the depth window flash on and off to alert you that the unit is not tracking the bottom. Understanding Sonar The transducer mounted on your vessel transmits sound waves toward the bottom of a lake, stream, or seabed in a cone-shaped pattern. When a transmitted sound wave strikes an underwater object-such as the bottom, a piece of structure, or a fish-sound is reflected back to the transducer. The transducer collects the reflected sound waves and sends the data to the GPSMAP 292/298 to process and show. The underwater data is shown on the Sonar Page in the order that it is returned: first returned is the first on the screen. Generally speaking, if the only thing between the transducer and the bottom is water, the first strong return comes from the bottom directly below the transducer and sets the bottom level. Weaker secondary returns provide the detailed data. Stronger returns show in darker colors, with the most intense color for the color scheme selected (default is red) being the strongest return. 80 GPSMAP 292/298 Owner's Manual
-
 1
1 -
2
-
3
-
4
-
5
-
6
-
7
-
8
-
9
-
10
-
11
-
12
-
13
-
14
-
15
-
16
-
17
-
18
-
19
-
20
-
21
-
22
-
23
-
24
-
25
-
26
-
27
-
28
-
29
-
30
-
31
-
32
-
33
-
34
-
35
-
36
-
37
-
38
-
39
-
40
-
41
-
42
-
43
-
44
-
45
-
46
-
47
-
48
-
49
-
50
-
51
-
52
-
53
-
54
-
55
-
56
-
57
-
58
-
59
-
60
-
61
-
62
-
63
-
64
-
65
-
66
-
67
-
68
-
69
-
70
-
71
-
72
-
73
-
74
-
75
-
76
-
77
-
78
-
79
-
80
-
 81
81 -
 82
82 -
 83
83 -
 84
84 -
 85
85 -
 86
86 -
 87
87 -
 88
88 -
 89
89 -
 90
90 -
 91
91 -
92
-
93
-
94
-
95
-
96
-
97
-
98
-
99
-
100
-
101
-
102
-
103
-
104
-
105
-
106
-
107
-
108
-
109
-
110
-
111
-
112
-
113
-
114
-
115
-
116
-
117
-
118
-
119
-
120
 |
 |