Dell Brocade 6520 Web Tools Administrator's Guide Supporting Fabric OS v7.1.0 - Page 129
Adding graphs to an existing canvas, Printing graphs, Modifying graphs
 |
View all Dell Brocade 6520 manuals
Add to My Manuals
Save this manual to your list of manuals |
Page 129 highlights
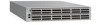
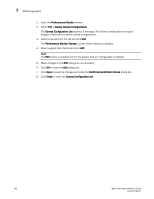
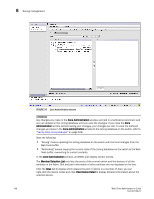
Adding graphs to an existing canvas 7 3. Select File > Save Current Canvas Configuration. The Save Canvas Configuration dialog box displays. 4. Enter a name and description for the configuration and click Save Canvas. A message displays, confirming that the configuration was successfully saved to the switch. Adding graphs to an existing canvas The following procedure assumes that a canvas is already created. To create a new canvas, you must first create graphs, as described in "Creating basic performance monitor graphs" on page 94 and "Advanced performance monitoring graphs" on page 97, and then save those graphs to a canvas, as described in "Saving graphs to a canvas" on page 100. To add a graph to an existing canvas, perform the following steps. 1. Select File > Display Canvas Configurations. The Canvas Configuration List displays. The error message "No Canvas configuration to display" displays if there are no saved canvas configurations. 2. Click a canvas in the list. 3. Click Edit. The Edit Canvas dialog box displays. 4. Click Add. A list of graphs displays. 5. Click a graph to add it to the canvas and click Save. Printing graphs You can print a single graph or all the graphs displayed on the selected canvas configuration. Only one canvas configuration can be opened at a time. To print a graph, perform the following steps. 1. Open the Performance Monitor window. 2. Create a basic or advanced Performance Monitor graph as described in "Creating basic performance monitor graphs" on page 94 and "Advanced performance monitoring graphs" on page 97. 3. To print a single graph, right-click the graph and choose Print. To print all the graphs displayed on the selected canvas configuration, select File > Print All Graphs. 4. In the print dialog box, click OK. Modifying graphs To modify an existing graph that is saved in a canvas, perform the following steps. Web Tools Administrator's Guide 101 53-1002756-01
-
 1
1 -
2
-
3
-
4
-
5
-
6
-
7
-
8
-
9
-
10
-
11
-
12
-
13
-
14
-
15
-
16
-
17
-
18
-
19
-
20
-
21
-
22
-
23
-
24
-
25
-
26
-
27
-
28
-
29
-
30
-
31
-
32
-
33
-
34
-
35
-
36
-
37
-
38
-
39
-
40
-
41
-
42
-
43
-
44
-
45
-
46
-
47
-
48
-
49
-
50
-
51
-
52
-
53
-
54
-
55
-
56
-
57
-
58
-
59
-
60
-
61
-
62
-
63
-
64
-
65
-
66
-
67
-
68
-
69
-
70
-
71
-
72
-
73
-
74
-
75
-
76
-
77
-
78
-
79
-
80
-
81
-
82
-
83
-
84
-
85
-
86
-
87
-
88
-
89
-
90
-
91
-
92
-
93
-
94
-
95
-
96
-
97
-
98
-
99
-
100
-
101
-
102
-
103
-
104
-
105
-
106
-
107
-
108
-
109
-
110
-
111
-
112
-
113
-
114
-
115
-
116
-
117
-
118
-
119
-
120
-
121
-
122
-
123
-
 124
124 -
 125
125 -
 126
126 -
 127
127 -
 128
128 -
 129
129 -
 130
130 -
 131
131 -
 132
132 -
 133
133 -
 134
134 -
135
-
136
-
137
-
138
-
139
-
140
-
141
-
142
-
143
-
144
-
145
-
146
-
147
-
148
-
149
-
150
-
151
-
152
-
153
-
154
-
155
-
156
-
157
-
158
-
159
-
160
-
161
-
162
-
163
-
164
-
165
-
166
-
167
-
168
-
169
-
170
-
171
-
172
-
173
-
174
-
175
-
176
-
177
-
178
-
179
-
180
-
181
-
182
-
183
-
184
-
185
-
186
-
187
-
188
-
189
-
190
-
191
-
192
-
193
-
194
-
195
-
196
-
197
-
198
-
199
-
200
-
201
-
202
-
203
-
204
-
205
-
206
-
207
-
208
-
209
-
210
-
211
-
212
-
213
-
214
-
215
-
216
-
217
-
218
-
219
-
220
-
221
-
222
-
223
-
224
-
225
-
226
-
227
-
228
-
229
-
230
-
231
-
232
-
233
-
234
-
235
-
236
-
237
-
238
-
239
-
240
-
241
-
242
-
243
-
244
-
245
-
246
-
247
-
248
-
249
-
250
-
251
-
252
-
253
-
254
-
255
-
256
-
257
-
258
-
259
-
260
-
261
-
262
-
263
-
264
-
265
-
266
-
267
-
268
 |
 |
