Dell Brocade 6520 Web Tools Administrator's Guide Supporting Fabric OS v7.1.0 - Page 77
Displaying Switch Events, Filtering events by event severity levels, Switch Events, Fabric Tree
 |
View all Dell Brocade 6520 manuals
Add to My Manuals
Save this manual to your list of manuals |
Page 77 highlights
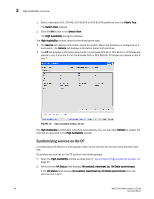
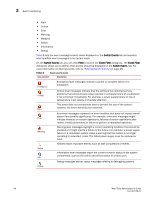
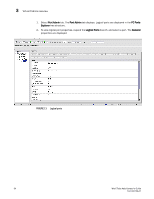
Event monitoring 3 Displaying Switch Events The Switch Events tab displays a running log of events for the selected switch. Switch events are polled and updated every 15 seconds; there is no refresh-on-demand option for switch events. For two-switch configurations, all chassis-related events are displayed in the event list of each logical switch for convenience. To display Switch Events, perform the following steps. 1. Select the switch from the Fabric Tree. The Switch View displays. 2. Select the Switch Events tab, if necessary. Filtering Switch Events You can filter the fabric and switch events by time, severity, message ID, and service. You can apply either one type of filter at a time or multiple types of filters at the same time. When a filter is applied, the filter information displays at the bottom of the filtered information and the Show All link is available to allow you to view the information unfiltered. To filter switch events, perform the following the procedure. 1. Open the Switch Events tab as described in "Displaying Switch Events" on page 49. 2. Click Filter. The Event Filter dialog box displays. 3. To filter events within a certain time period: • Select the From check box and enter the start time and date in the fields. • Select the To check box and enter the finish time and date in the fields. • To filter events beginning at a certain date and time, select only the From check box and enter the start time and date. • To filter events up until a certain date and time, select only the To check box and enter the finish time and date. 4. Click OK. The filter is enabled and the window is refreshed to show the filtered information. Filtering events by event severity levels To filter events by event severity levels, perform the following steps. 1. Open the Switch Events tab as described in "Displaying Switch Events" on page 49. 2. Click Filter. The Event Filter dialog box displays. 3. Select Level. 4. Select the event levels you want to display. 5. Click OK. Web Tools Administrator's Guide 49 53-1002756-01
-
 1
1 -
2
-
3
-
4
-
5
-
6
-
7
-
8
-
9
-
10
-
11
-
12
-
13
-
14
-
15
-
16
-
17
-
18
-
19
-
20
-
21
-
22
-
23
-
24
-
25
-
26
-
27
-
28
-
29
-
30
-
31
-
32
-
33
-
34
-
35
-
36
-
37
-
38
-
39
-
40
-
41
-
42
-
43
-
44
-
45
-
46
-
47
-
48
-
49
-
50
-
51
-
52
-
53
-
54
-
55
-
56
-
57
-
58
-
59
-
60
-
61
-
62
-
63
-
64
-
65
-
66
-
67
-
68
-
69
-
70
-
71
-
 72
72 -
 73
73 -
 74
74 -
 75
75 -
 76
76 -
 77
77 -
 78
78 -
 79
79 -
 80
80 -
 81
81 -
 82
82 -
83
-
84
-
85
-
86
-
87
-
88
-
89
-
90
-
91
-
92
-
93
-
94
-
95
-
96
-
97
-
98
-
99
-
100
-
101
-
102
-
103
-
104
-
105
-
106
-
107
-
108
-
109
-
110
-
111
-
112
-
113
-
114
-
115
-
116
-
117
-
118
-
119
-
120
-
121
-
122
-
123
-
124
-
125
-
126
-
127
-
128
-
129
-
130
-
131
-
132
-
133
-
134
-
135
-
136
-
137
-
138
-
139
-
140
-
141
-
142
-
143
-
144
-
145
-
146
-
147
-
148
-
149
-
150
-
151
-
152
-
153
-
154
-
155
-
156
-
157
-
158
-
159
-
160
-
161
-
162
-
163
-
164
-
165
-
166
-
167
-
168
-
169
-
170
-
171
-
172
-
173
-
174
-
175
-
176
-
177
-
178
-
179
-
180
-
181
-
182
-
183
-
184
-
185
-
186
-
187
-
188
-
189
-
190
-
191
-
192
-
193
-
194
-
195
-
196
-
197
-
198
-
199
-
200
-
201
-
202
-
203
-
204
-
205
-
206
-
207
-
208
-
209
-
210
-
211
-
212
-
213
-
214
-
215
-
216
-
217
-
218
-
219
-
220
-
221
-
222
-
223
-
224
-
225
-
226
-
227
-
228
-
229
-
230
-
231
-
232
-
233
-
234
-
235
-
236
-
237
-
238
-
239
-
240
-
241
-
242
-
243
-
244
-
245
-
246
-
247
-
248
-
249
-
250
-
251
-
252
-
253
-
254
-
255
-
256
-
257
-
258
-
259
-
260
-
261
-
262
-
263
-
264
-
265
-
266
-
267
-
268
 |
 |