Dell Brocade 6520 Web Tools Administrator's Guide Supporting Fabric OS v7.1.0 - Page 49
Switch View buttons, Switch View, Port representations
 |
View all Dell Brocade 6520 manuals
Add to My Manuals
Save this manual to your list of manuals |
Page 49 highlights
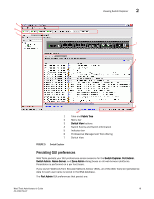
Viewing Switch Explorer 2 Although Fabric Tree displays all the switches in the fabric, you can manage switches that support Fabric OS v6.1 and later versions because it does not requires Web Tools license. If a switch is launched from Fabric Tree, preference will be given to IPv4, even though both IPv4 and IPv6 are configured for that particular switch. The versions earlier than Fabric OS v6.1 require a Web Tools license and, if applicable, an EGM license installed. Other switches must be managed through the Fabric OS command line interface (CLI), another management application, or by using Brocade Network Advisor. Switch View buttons The Switch View buttons let you access the following switch information: • Status-Click the button to view the status of the switch. • Temp-Click the button to view temperature monitors. • Power-Click the button to view power supply information. • Fan-Click the button to view the status of the switch fans. NOTE For all status displays based on errors per time interval, any errors cause the status to show faulty until the entire sample interval has passed. Switch View You can click the small right arrow towards the left of the Switch Event tab to display the Switch View. The Switch View displays a graphical representation of the switch, including a real-time view of switch and port status. Refer to area 7 in Figure 5 on page 19. NOTE: With the upgrade license installed: • For 7800, all FC ports and 6 GbE ports are enabled Without the upgrade license installed: • For 7800, 4 FC ports and 2 GbE ports are enabled NOTE Blades are graphically represented in the Web Tools GUI. They are vertical in the DCX, and horizontal in the DCX-4S. The default Switch View display refresh rate is 60 seconds. However, the initial display of Switch Explorer might take from 30 to 60 seconds after the switch is booted. Refresh rates are fabric-size dependent. The auto refresh interval may not be less than 45 seconds. However, the refresh rate varies depending on the activity in the fabric and on the host system you are using. The larger the fabric, the longer it takes to poll the fabric and refresh the view. F_Port and L_Port connection changes refresh immediately. Port representations The ports in the Switch View show the port type. Borders around the accessible ports indicate that SFP modules are present. A colored border indicates the status of the port; for example, a green border indicates that the port is connected and traffic is flowing. Ports that are not accessible do not display the port type and do not have borders. Web Tools Administrator's Guide 21 53-1002756-01
-
 1
1 -
2
-
3
-
4
-
5
-
6
-
7
-
8
-
9
-
10
-
11
-
12
-
13
-
14
-
15
-
16
-
17
-
18
-
19
-
20
-
21
-
22
-
23
-
24
-
25
-
26
-
27
-
28
-
29
-
30
-
31
-
32
-
33
-
34
-
35
-
36
-
37
-
38
-
39
-
40
-
41
-
42
-
43
-
 44
44 -
 45
45 -
 46
46 -
 47
47 -
 48
48 -
 49
49 -
 50
50 -
 51
51 -
 52
52 -
 53
53 -
 54
54 -
55
-
56
-
57
-
58
-
59
-
60
-
61
-
62
-
63
-
64
-
65
-
66
-
67
-
68
-
69
-
70
-
71
-
72
-
73
-
74
-
75
-
76
-
77
-
78
-
79
-
80
-
81
-
82
-
83
-
84
-
85
-
86
-
87
-
88
-
89
-
90
-
91
-
92
-
93
-
94
-
95
-
96
-
97
-
98
-
99
-
100
-
101
-
102
-
103
-
104
-
105
-
106
-
107
-
108
-
109
-
110
-
111
-
112
-
113
-
114
-
115
-
116
-
117
-
118
-
119
-
120
-
121
-
122
-
123
-
124
-
125
-
126
-
127
-
128
-
129
-
130
-
131
-
132
-
133
-
134
-
135
-
136
-
137
-
138
-
139
-
140
-
141
-
142
-
143
-
144
-
145
-
146
-
147
-
148
-
149
-
150
-
151
-
152
-
153
-
154
-
155
-
156
-
157
-
158
-
159
-
160
-
161
-
162
-
163
-
164
-
165
-
166
-
167
-
168
-
169
-
170
-
171
-
172
-
173
-
174
-
175
-
176
-
177
-
178
-
179
-
180
-
181
-
182
-
183
-
184
-
185
-
186
-
187
-
188
-
189
-
190
-
191
-
192
-
193
-
194
-
195
-
196
-
197
-
198
-
199
-
200
-
201
-
202
-
203
-
204
-
205
-
206
-
207
-
208
-
209
-
210
-
211
-
212
-
213
-
214
-
215
-
216
-
217
-
218
-
219
-
220
-
221
-
222
-
223
-
224
-
225
-
226
-
227
-
228
-
229
-
230
-
231
-
232
-
233
-
234
-
235
-
236
-
237
-
238
-
239
-
240
-
241
-
242
-
243
-
244
-
245
-
246
-
247
-
248
-
249
-
250
-
251
-
252
-
253
-
254
-
255
-
256
-
257
-
258
-
259
-
260
-
261
-
262
-
263
-
264
-
265
-
266
-
267
-
268
 |
 |