Netgear GS748Tv5 Software Administration Manual - Page 240
Memory Logs, To con the memory log settings, Monitoring, Enable, Disable, Stop on Ful, Apply
 |
View all Netgear GS748Tv5 manuals
Add to My Manuals
Save this manual to your list of manuals |
Page 240 highlights
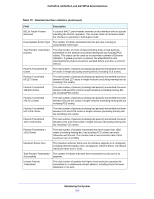
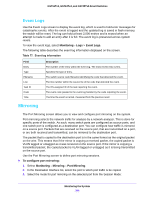
GS716Tv3, GS724Tv4, and GS748Tv5 Smart Switches Memory Logs The Memory Log stores messages in memory based upon the settings for message component and severity. Use the Memory Log screen to set the administrative status and behavior of logs in the system buffer. These log messages are cleared when the switch reboots. To configure the memory log settings: 1. Select Monitoring > Logs > Memory Log. 2. Next to Admin Status, select one of the following radio buttons: • Enable. Enable system logging. • Disable. Prevent the system from logging messages. 3. From the Behavior list, specify the behavior of the log when it is full. • Wrap. When the buffer is full, the oldest log messages are deleted as the system logs new messages. • Stop on Full. When the buffer is full, the system stops logging new messages and preserves all existing log messages. 4. Click the Apply button. The Memory Log table displays on the Memory Log screen. The Total Number of messages displays the number of messages the system has logged in memory. Only the 200 most recent entries are displayed on the screen. The rest of the screen displays the Memory Log messages. The format of the log message is the same for messages that are displayed for the message log, persistent log, or console log. Messages logged to a collector or relay through syslog have the same format as well. The following example shows the standard format for a log message: Mar 24 05:34:05 10.131.12.183-1 UNKN[2176789276]: main_login.c(179) 3855 %% HTTP Session 19 initiated for user admin connected from 10.27.64.122 The number contained in the angle brackets represents the message priority, which is derived from the following values: Priority = (facility value × 8) + severity level. The facility value is usually one, which means it is a user-level message. Therefore, to determine the severity level of the message, subtract eight from the number in the angle brackets. The example log message has a severity level of 6 (informational). For more information about the severity of a log message, see Server Log on page 242. The message was generated on March 24 at 5:34:05 a.m. by the switch with an IP address of 10.131.12.183. The component that generated the message is unknown, but it came from line 179 of the main_login.c file. This is the 3,855th message logged since the switch was last booted. The message indicates that the administrator logged on to the HTTP management interface from a host with an IP address of 10.27.64.122. Monitoring the System 240
-
 1
1 -
2
-
3
-
4
-
5
-
6
-
7
-
8
-
9
-
10
-
11
-
12
-
13
-
14
-
15
-
16
-
17
-
18
-
19
-
20
-
21
-
22
-
23
-
24
-
25
-
26
-
27
-
28
-
29
-
30
-
31
-
32
-
33
-
34
-
35
-
36
-
37
-
38
-
39
-
40
-
41
-
42
-
43
-
44
-
45
-
46
-
47
-
48
-
49
-
50
-
51
-
52
-
53
-
54
-
55
-
56
-
57
-
58
-
59
-
60
-
61
-
62
-
63
-
64
-
65
-
66
-
67
-
68
-
69
-
70
-
71
-
72
-
73
-
74
-
75
-
76
-
77
-
78
-
79
-
80
-
81
-
82
-
83
-
84
-
85
-
86
-
87
-
88
-
89
-
90
-
91
-
92
-
93
-
94
-
95
-
96
-
97
-
98
-
99
-
100
-
101
-
102
-
103
-
104
-
105
-
106
-
107
-
108
-
109
-
110
-
111
-
112
-
113
-
114
-
115
-
116
-
117
-
118
-
119
-
120
-
121
-
122
-
123
-
124
-
125
-
126
-
127
-
128
-
129
-
130
-
131
-
132
-
133
-
134
-
135
-
136
-
137
-
138
-
139
-
140
-
141
-
142
-
143
-
144
-
145
-
146
-
147
-
148
-
149
-
150
-
151
-
152
-
153
-
154
-
155
-
156
-
157
-
158
-
159
-
160
-
161
-
162
-
163
-
164
-
165
-
166
-
167
-
168
-
169
-
170
-
171
-
172
-
173
-
174
-
175
-
176
-
177
-
178
-
179
-
180
-
181
-
182
-
183
-
184
-
185
-
186
-
187
-
188
-
189
-
190
-
191
-
192
-
193
-
194
-
195
-
196
-
197
-
198
-
199
-
200
-
201
-
202
-
203
-
204
-
205
-
206
-
207
-
208
-
209
-
210
-
211
-
212
-
213
-
214
-
215
-
216
-
217
-
218
-
219
-
220
-
221
-
222
-
223
-
224
-
225
-
226
-
227
-
228
-
229
-
230
-
231
-
232
-
233
-
234
-
 235
235 -
 236
236 -
 237
237 -
 238
238 -
 239
239 -
 240
240 -
 241
241 -
 242
242 -
 243
243 -
 244
244 -
 245
245 -
246
-
247
-
248
-
249
-
250
-
251
-
252
-
253
-
254
-
255
-
256
-
257
-
258
-
259
-
260
-
261
-
262
-
263
-
264
-
265
-
266
-
267
-
268
-
269
-
270
-
271
-
272
-
273
-
274
-
275
-
276
-
277
-
278
-
279
-
280
-
281
-
282
-
283
-
284
-
285
-
286
-
287
-
288
-
289
-
290
 |
 |