Cisco 3825 Hardware Installation Guide - Page 191
Power Budget and Power Margin, Link Loss, Transceiver Type, Maximum Distance Between Stations
 |
UPC - 746320981505
View all Cisco 3825 manuals
Add to My Manuals
Save this manual to your list of manuals |
Page 191 highlights
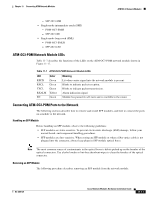
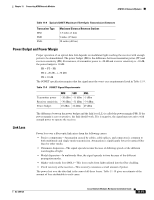
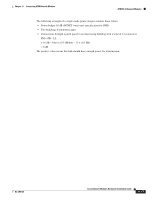
Chapter 11 Connecting ATM Network Modules ATM OC-3 Network Modules Table 11-8 Typical SONET Maximum Fiber-Optic Transmission Distances Transceiver Type MM SMI SML Maximum Distance Between Stations 1.5 miles (2 km) 9 miles (15 km) 28 miles (40 km) Power Budget and Power Margin Proper operation of an optical data link depends on modulated light reaching the receiver with enough power to be demodulated. The power budget (PB) is the difference between transmitter power (PT) and receiver sensitivity (PR). For instance, if transmitter power is -20 dB and receiver sensitivity is -30 dB, the power budget is 10 dB: PB = PT - PR PB = -20 dB - (-30 dB) PB = 10 dB The SONET specification requires that the signal meet the worst-case requirements listed in Table 11-9. Table 11-9 SONET Signal Requirements Transmitter power Receiver sensitivity Power budget MM SMI SML -20 dBm -15 dBm -5 dBm -30 dBm -31 dBm -34 dBm 10 dBm 16 dBm 29 dBm The difference between the power budget and the link loss (LL) is called the power margin (PM). If the power margin is zero or positive, the link should work. If it is negative, the signal may not arrive with enough power to operate the receiver. Link Loss Power loss over a fiber-optic link arises from the following causes: • Passive components-Attenuation caused by cables, cable splices, and connectors is common to both multimode and single-mode transmission. Attenuation is significantly lower for optical fiber than for other media. • Chromatic dispersion-The signal spreads in time because of differing speeds of the different wavelengths of light. • Modal dispersion-In multimode fiber, the signal spreads in time because of the different propagation modes. • Higher-order mode loss (HOL)-This loss results from light radiated into the fiber cladding. • Clock recovery at the receiver-This recovery consumes a small amount of power. The power lost over the data link is the sum of all these losses. Table 11-10 gives an estimate of the amount of loss attributable to each cause. OL-2485-20 Cisco Network Modules Hardware Installation Guide 11-15
-
 1
1 -
2
-
3
-
4
-
5
-
6
-
7
-
8
-
9
-
10
-
11
-
12
-
13
-
14
-
15
-
16
-
17
-
18
-
19
-
20
-
21
-
22
-
23
-
24
-
25
-
26
-
27
-
28
-
29
-
30
-
31
-
32
-
33
-
34
-
35
-
36
-
37
-
38
-
39
-
40
-
41
-
42
-
43
-
44
-
45
-
46
-
47
-
48
-
49
-
50
-
51
-
52
-
53
-
54
-
55
-
56
-
57
-
58
-
59
-
60
-
61
-
62
-
63
-
64
-
65
-
66
-
67
-
68
-
69
-
70
-
71
-
72
-
73
-
74
-
75
-
76
-
77
-
78
-
79
-
80
-
81
-
82
-
83
-
84
-
85
-
86
-
87
-
88
-
89
-
90
-
91
-
92
-
93
-
94
-
95
-
96
-
97
-
98
-
99
-
100
-
101
-
102
-
103
-
104
-
105
-
106
-
107
-
108
-
109
-
110
-
111
-
112
-
113
-
114
-
115
-
116
-
117
-
118
-
119
-
120
-
121
-
122
-
123
-
124
-
125
-
126
-
127
-
128
-
129
-
130
-
131
-
132
-
133
-
134
-
135
-
136
-
137
-
138
-
139
-
140
-
141
-
142
-
143
-
144
-
145
-
146
-
147
-
148
-
149
-
150
-
151
-
152
-
153
-
154
-
155
-
156
-
157
-
158
-
159
-
160
-
161
-
162
-
163
-
164
-
165
-
166
-
167
-
168
-
169
-
170
-
171
-
172
-
173
-
174
-
175
-
176
-
177
-
178
-
179
-
180
-
181
-
182
-
183
-
184
-
185
-
 186
186 -
 187
187 -
 188
188 -
 189
189 -
 190
190 -
 191
191 -
 192
192 -
 193
193 -
 194
194 -
 195
195 -
 196
196 -
197
-
198
-
199
-
200
-
201
-
202
-
203
-
204
-
205
-
206
-
207
-
208
-
209
-
210
-
211
-
212
-
213
-
214
-
215
-
216
-
217
-
218
-
219
-
220
-
221
-
222
-
223
-
224
-
225
-
226
-
227
-
228
-
229
-
230
-
231
-
232
-
233
-
234
-
235
-
236
-
237
-
238
-
239
-
240
-
241
-
242
-
243
-
244
-
245
-
246
-
247
-
248
-
249
-
250
-
251
-
252
-
253
-
254
-
255
-
256
-
257
-
258
-
259
-
260
-
261
-
262
-
263
-
264
-
265
-
266
-
267
-
268
-
269
-
270
-
271
-
272
-
273
-
274
-
275
-
276
-
277
-
278
-
279
-
280
-
281
-
282
-
283
-
284
-
285
-
286
-
287
-
288
-
289
-
290
-
291
-
292
-
293
-
294
-
295
-
296
-
297
-
298
-
299
-
300
-
301
-
302
-
303
-
304
-
305
-
306
-
307
-
308
-
309
-
310
-
311
-
312
-
313
-
314
-
315
-
316
-
317
-
318
-
319
-
320
-
321
-
322
-
323
-
324
-
325
-
326
-
327
-
328
-
329
-
330
-
331
-
332
-
333
-
334
-
335
-
336
-
337
-
338
-
339
-
340
-
341
-
342
-
343
-
344
-
345
-
346
-
347
-
348
-
349
-
350
-
351
-
352
-
353
-
354
-
355
-
356
-
357
-
358
-
359
-
360
-
361
-
362
-
363
-
364
-
365
-
366
-
367
-
368
-
369
-
370
-
371
-
372
-
373
-
374
-
375
-
376
-
377
-
378
-
379
-
380
-
381
-
382
-
383
-
384
-
385
-
386
-
387
-
388
-
389
-
390
-
391
-
392
-
393
-
394
-
395
-
396
-
397
-
398
-
399
-
400
-
401
-
402
-
403
-
404
-
405
-
406
-
407
-
408
-
409
-
410
-
411
-
412
-
413
-
414
-
415
-
416
-
417
-
418
 |
 |