Garmin Forerunner 955 Solar Owners Manual - Page 33
Viewing the Heart Rate Glance, Menstrual Cycle Tracking, Using the Stress Level Glance, START
 |
View all Garmin Forerunner 955 Solar manuals
Add to My Manuals
Save this manual to your list of manuals |
Page 33 highlights
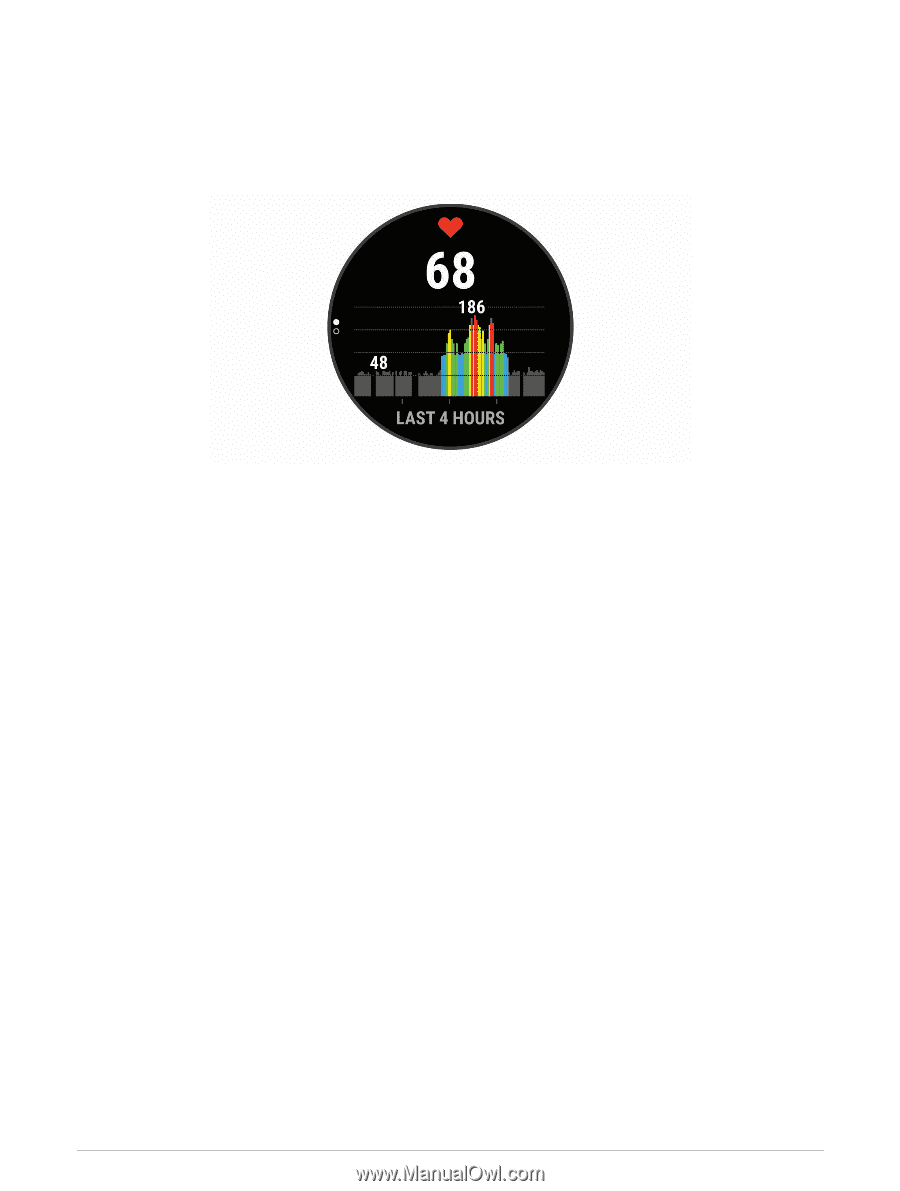
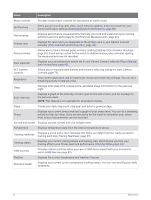
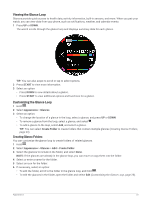
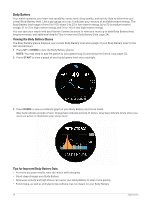
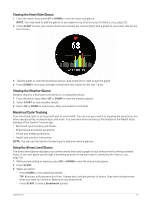
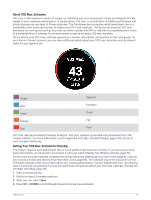
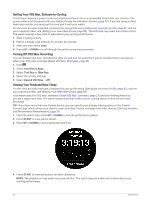
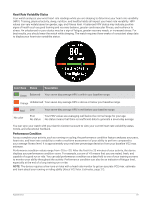
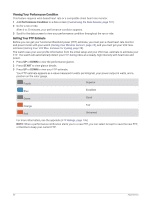
Viewing the Heart Rate Glance 1 From the watch face, press UP or DOWN to view the heart rate glance. NOTE: You may need to add the glance to your glance loop (Customizing the Glance Loop, page 23). 2 Press START to view your current heart rate in beats per minute (bpm) and a graph of your heart rate for the last 4 hours. 3 Tap the graph to view the directional arrows, and swipe left or right to pan the graph. 4 Press DOWN to view your average resting heart rate values for the last 7 days. Viewing the Weather Glance Weather requires a Bluetooth connection to a compatible phone. 1 From the watch face, select UP or DOWN to view the weather glance. 2 Select START to view weather details. 3 Select UP or DOWN to view hourly, daily, and weather trend data. Menstrual Cycle Tracking Your menstrual cycle is an important part of your health. You can use your watch to log physical symptoms, sex drive, sexual activity, ovulation days, and more. You can learn more and set up this feature in the Health Stats settings of the Garmin Connect app. • Menstrual cycle tracking and details • Physical and emotional symptoms • Period and fertility predictions • Health and nutrition information NOTE: You can use the Garmin Connect app to add and remove glances. Using the Stress Level Glance The stress level glance displays your current stress level and a graph of your stress level for the last several hours. It can also guide you through a breathing activity to help you relax (Customizing the Glance Loop, page 23). 1 While you are sitting or inactive, press UP or DOWN to view the stress level glance. 2 Press START. 3 Select an option: • Press DOWN to view additional details. TIP: Blue bars indicate periods of rest. Orange bars indicate periods of stress. Gray bars indicate times when you were too active to determine your stress level. • Press START to start a Breathwork activity. Appearance 25
-
 1
1 -
2
-
3
-
4
-
5
-
6
-
7
-
8
-
9
-
10
-
11
-
12
-
13
-
14
-
15
-
16
-
17
-
18
-
19
-
20
-
21
-
22
-
23
-
24
-
25
-
26
-
27
-
 28
28 -
 29
29 -
 30
30 -
 31
31 -
 32
32 -
 33
33 -
 34
34 -
 35
35 -
 36
36 -
 37
37 -
 38
38 -
39
-
40
-
41
-
42
-
43
-
44
-
45
-
46
-
47
-
48
-
49
-
50
-
51
-
52
-
53
-
54
-
55
-
56
-
57
-
58
-
59
-
60
-
61
-
62
-
63
-
64
-
65
-
66
-
67
-
68
-
69
-
70
-
71
-
72
-
73
-
74
-
75
-
76
-
77
-
78
-
79
-
80
-
81
-
82
-
83
-
84
-
85
-
86
-
87
-
88
-
89
-
90
-
91
-
92
-
93
-
94
-
95
-
96
-
97
-
98
-
99
-
100
-
101
-
102
-
103
-
104
-
105
-
106
-
107
-
108
-
109
-
110
-
111
-
112
-
113
-
114
-
115
-
116
-
117
-
118
-
119
-
120
-
121
-
122
-
123
-
124
-
125
-
126
-
127
-
128
-
129
-
130
-
131
-
132
-
133
-
134
-
135
-
136
-
137
-
138
-
139
-
140
-
141
-
142
-
143
-
144
-
145
-
146
 |
 |