Netgear R6250 User Manual - Page 78
Show Statistics Button, Administration > Router Status
 |
View all Netgear R6250 manuals
Add to My Manuals
Save this manual to your list of manuals |
Page 78 highlights
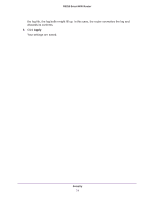
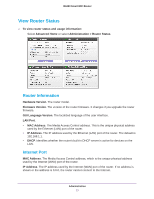
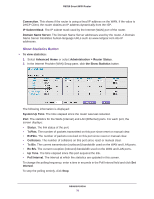
R6250 Smart WiFi Router Connection. This shows if the router is using a fixed IP address on the WAN. If the value is DHCP Client, the router obtains an IP address dynamically from the ISP. IP Subnet Mask. The IP subnet mask used by the Internet (WAN) port of the router. Domain Name Server. The Domain Name Server addresses used by the router. A Domain Name Server translates human-language URLs such as www.netgear.com into IP addresses. Show Statistics Button To view statistics: 1. Select Advanced Home or select Administration > Router Status. 2. In the Internet Provider (WAN) Setup pane, click the Show Statistics button. The following information is displayed: System Up Time. The time elapsed since the router was last restarted. Port. The statistics for the WAN (Internet) and LAN (Ethernet) ports. For each port, the screen displays: • Status. The link status of the port. • TxPkts. The number of packets transmitted on this port since reset or manual clear. • RxPkts. The number of packets received on this port since reset or manual clear. • Collisions. The number of collisions on this port since reset or manual clear. • Tx B/s. The current transmission (outbound) bandwidth used on the WAN and LAN ports. • Rx B/s. The current reception (inbound) bandwidth used on the WAN and LAN ports. • Up Time. The time elapsed since this port acquired the link. • Poll Interval. The interval at which the statistics are updated in this screen. To change the polling frequency, enter a time in seconds in the Poll Interval field and click Set Interval. To stop the polling entirely, click Stop. Administration 78
-
 1
1 -
2
-
3
-
4
-
5
-
6
-
7
-
8
-
9
-
10
-
11
-
12
-
13
-
14
-
15
-
16
-
17
-
18
-
19
-
20
-
21
-
22
-
23
-
24
-
25
-
26
-
27
-
28
-
29
-
30
-
31
-
32
-
33
-
34
-
35
-
36
-
37
-
38
-
39
-
40
-
41
-
42
-
43
-
44
-
45
-
46
-
47
-
48
-
49
-
50
-
51
-
52
-
53
-
54
-
55
-
56
-
57
-
58
-
59
-
60
-
61
-
62
-
63
-
64
-
65
-
66
-
67
-
68
-
69
-
70
-
71
-
72
-
 73
73 -
 74
74 -
 75
75 -
 76
76 -
 77
77 -
 78
78 -
 79
79 -
 80
80 -
 81
81 -
 82
82 -
 83
83 -
84
-
85
-
86
-
87
-
88
-
89
-
90
-
91
-
92
-
93
-
94
-
95
-
96
-
97
-
98
-
99
-
100
-
101
-
102
-
103
-
104
-
105
-
106
-
107
-
108
-
109
-
110
-
111
-
112
-
113
-
114
-
115
-
116
-
117
-
118
-
119
-
120
-
121
-
122
-
123
-
124
-
125
-
126
-
127
-
128
-
129
 |
 |