HP StorageWorks MSA 2/8 HP StorageWorks Fabric Watch V3.1.x/4.1.x User Guide ( - Page 202
Table 24: Fabric-Class Threshold Defaults, Table 24
 |
View all HP StorageWorks MSA 2/8 manuals
Add to My Manuals
Save this manual to your list of manuals |
Page 202 highlights
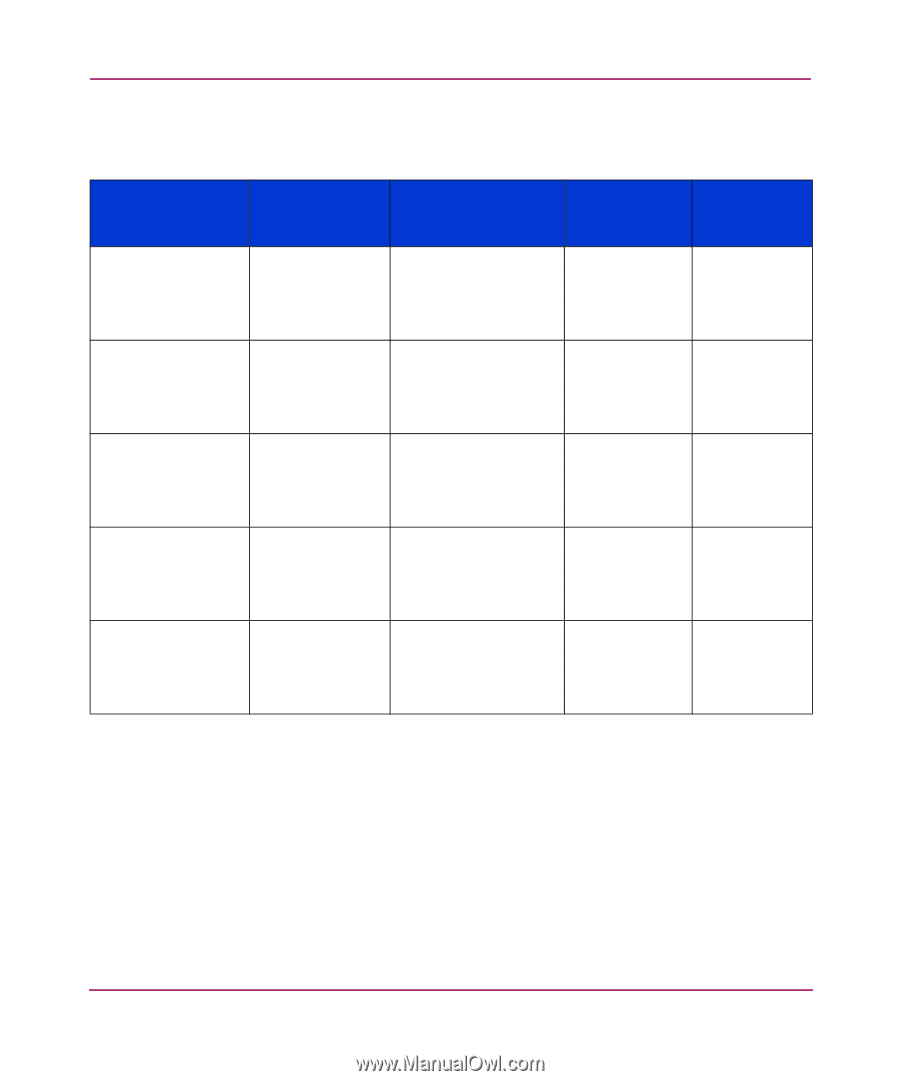
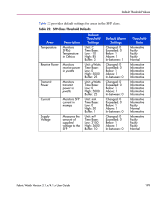
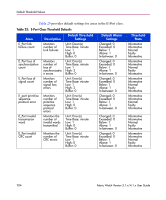
Default Threshold Values Table 24 provides default settings for areas in the Fabric class. Table 24: Fabric-Class Threshold Defaults Area E-Port Downs Fabric Reconfiguration Domain ID Changes Segmentation Changes Zone Changes Description Monitors E_Port status Monitors configuration changes Monitors forcible DOMAIN Id changes Monitors segmentation changes Monitors zone changes Default Threshold Settings Unit: Down(s) Time Base: Low: 0 High: 0 Buffer: 0 Unit: Reconfig(s) Time Base: Low: 0 High: 0 Buffer: 0 Unit: DID Change(s) Time Base: Low: 0 High: 0 Buffer: 0 Unit: Segmentation(s) Time Base: Low: 0 High: 0 Buffer: 0 Unit: Zone Change(s) Time Base: Low: 0 High: 0 Buffer: 0 Default Alarm Settings Changed: 0 Exceeded: 0 Below: 0 Above: 0 In-between: 0 Changed: 0 Exceeded: 0 Below: 0 Above: 0 In-between: 0 Changed: 0 Exceeded: 0 Below: 0 Above: 0 In-between: 0 Changed: 0 Exceeded: 0 Below: 0 Above: 0 In-between: 0 Changed: 0 Exceeded: 0 Below: 0 Above: 0 In-between: 0 Threshold State Informative Informative Informative Informative Informative Informative Informative Informative Informative Informative Informative Informative Informative Informative Informative Informative Informative Informative Informative Informative Informative Informative Informative Informative Informative 202 Fabric Watch Version 3.1.x/4.1.x User Guide
-
 1
1 -
2
-
3
-
4
-
5
-
6
-
7
-
8
-
9
-
10
-
11
-
12
-
13
-
14
-
15
-
16
-
17
-
18
-
19
-
20
-
21
-
22
-
23
-
24
-
25
-
26
-
27
-
28
-
29
-
30
-
31
-
32
-
33
-
34
-
35
-
36
-
37
-
38
-
39
-
40
-
41
-
42
-
43
-
44
-
45
-
46
-
47
-
48
-
49
-
50
-
51
-
52
-
53
-
54
-
55
-
56
-
57
-
58
-
59
-
60
-
61
-
62
-
63
-
64
-
65
-
66
-
67
-
68
-
69
-
70
-
71
-
72
-
73
-
74
-
75
-
76
-
77
-
78
-
79
-
80
-
81
-
82
-
83
-
84
-
85
-
86
-
87
-
88
-
89
-
90
-
91
-
92
-
93
-
94
-
95
-
96
-
97
-
98
-
99
-
100
-
101
-
102
-
103
-
104
-
105
-
106
-
107
-
108
-
109
-
110
-
111
-
112
-
113
-
114
-
115
-
116
-
117
-
118
-
119
-
120
-
121
-
122
-
123
-
124
-
125
-
126
-
127
-
128
-
129
-
130
-
131
-
132
-
133
-
134
-
135
-
136
-
137
-
138
-
139
-
140
-
141
-
142
-
143
-
144
-
145
-
146
-
147
-
148
-
149
-
150
-
151
-
152
-
153
-
154
-
155
-
156
-
157
-
158
-
159
-
160
-
161
-
162
-
163
-
164
-
165
-
166
-
167
-
168
-
169
-
170
-
171
-
172
-
173
-
174
-
175
-
176
-
177
-
178
-
179
-
180
-
181
-
182
-
183
-
184
-
185
-
186
-
187
-
188
-
189
-
190
-
191
-
192
-
193
-
194
-
195
-
196
-
 197
197 -
 198
198 -
 199
199 -
 200
200 -
 201
201 -
 202
202 -
 203
203 -
 204
204 -
 205
205 -
 206
206 -
 207
207 -
208
-
209
-
210
-
211
-
212
-
213
-
214
-
215
-
216
-
217
-
218
-
219
-
220
-
221
-
222
-
223
-
224
-
225
-
226
-
227
-
228
-
229
-
230
-
231
-
232
-
233
-
234
-
235
-
236
-
237
-
238
-
239
-
240
-
241
-
242
-
243
-
244
-
245
-
246
-
247
-
248
-
249
-
250
-
251
-
252
-
253
-
254
-
255
-
256
-
257
-
258
-
259
-
260
-
261
-
262
-
263
-
264
-
265
-
266
-
267
 |
 |