HP StorageWorks MSA 2/8 HP StorageWorks Fabric Watch V3.1.x/4.1.x User Guide ( - Page 209
Table 30: Switch Availability Monitor-Class Threshold Defaults, Table 30
 |
View all HP StorageWorks MSA 2/8 manuals
Add to My Manuals
Save this manual to your list of manuals |
Page 209 highlights
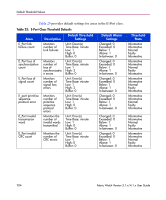
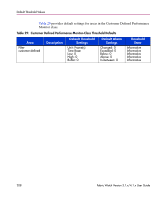
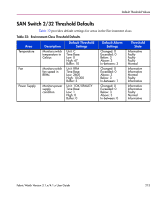
Default Threshold Values Table 30 provides default settings for areas in the Switch Availability Monitor class. Table 30: Switch Availability Monitor-Class Threshold Defaults Area Down Time Up Time Duration of Occurrence Frequency of Occurrence Description Monitors port downtime Monitors port uptime Monitors duration of occurrences of faulty ports Monitors frequency of occurrences of faulty ports Default Threshold Settings Unit: Percentage(s) Time Base: Low: 0 High: 1 Buffer: 0 Unit: Percentage(s) Time Base: Low: 0 High: 1 Buffer: 0 Unit: Percentage(s) Time Base: Low: 0 High: 1 Buffer: 0 Unit: Percentage(s) Time Base: Low: 0 High: 1 Buffer: 0 Default Alarm Settings Changed: 0 Exceeded: 0 Below: 1 Above: 1 In-Between: 1 Changed: 0 Exceeded: 0 Below: 1 Above: 1 In-Between: 0 Changed: 0 Exceeded: 0 Below: 1 Above: 1 In-Between: 0 Changed: 0 Exceeded: 0 Below: 1 Above: 1 In-Between: 0 Threshold State Informational Informational Normal Informational Informational Informational Informational Informational Normal Informational Informational Informational Normal Informational Informational Informational Informational Normal Informational Informational Fabric Watch Version 3.1.x/4.1.x User Guide 209
-
 1
1 -
2
-
3
-
4
-
5
-
6
-
7
-
8
-
9
-
10
-
11
-
12
-
13
-
14
-
15
-
16
-
17
-
18
-
19
-
20
-
21
-
22
-
23
-
24
-
25
-
26
-
27
-
28
-
29
-
30
-
31
-
32
-
33
-
34
-
35
-
36
-
37
-
38
-
39
-
40
-
41
-
42
-
43
-
44
-
45
-
46
-
47
-
48
-
49
-
50
-
51
-
52
-
53
-
54
-
55
-
56
-
57
-
58
-
59
-
60
-
61
-
62
-
63
-
64
-
65
-
66
-
67
-
68
-
69
-
70
-
71
-
72
-
73
-
74
-
75
-
76
-
77
-
78
-
79
-
80
-
81
-
82
-
83
-
84
-
85
-
86
-
87
-
88
-
89
-
90
-
91
-
92
-
93
-
94
-
95
-
96
-
97
-
98
-
99
-
100
-
101
-
102
-
103
-
104
-
105
-
106
-
107
-
108
-
109
-
110
-
111
-
112
-
113
-
114
-
115
-
116
-
117
-
118
-
119
-
120
-
121
-
122
-
123
-
124
-
125
-
126
-
127
-
128
-
129
-
130
-
131
-
132
-
133
-
134
-
135
-
136
-
137
-
138
-
139
-
140
-
141
-
142
-
143
-
144
-
145
-
146
-
147
-
148
-
149
-
150
-
151
-
152
-
153
-
154
-
155
-
156
-
157
-
158
-
159
-
160
-
161
-
162
-
163
-
164
-
165
-
166
-
167
-
168
-
169
-
170
-
171
-
172
-
173
-
174
-
175
-
176
-
177
-
178
-
179
-
180
-
181
-
182
-
183
-
184
-
185
-
186
-
187
-
188
-
189
-
190
-
191
-
192
-
193
-
194
-
195
-
196
-
197
-
198
-
199
-
200
-
201
-
202
-
203
-
 204
204 -
 205
205 -
 206
206 -
 207
207 -
 208
208 -
 209
209 -
 210
210 -
 211
211 -
 212
212 -
 213
213 -
 214
214 -
215
-
216
-
217
-
218
-
219
-
220
-
221
-
222
-
223
-
224
-
225
-
226
-
227
-
228
-
229
-
230
-
231
-
232
-
233
-
234
-
235
-
236
-
237
-
238
-
239
-
240
-
241
-
242
-
243
-
244
-
245
-
246
-
247
-
248
-
249
-
250
-
251
-
252
-
253
-
254
-
255
-
256
-
257
-
258
-
259
-
260
-
261
-
262
-
263
-
264
-
265
-
266
-
267
 |
 |