HP StorageWorks MSA 2/8 HP StorageWorks Fabric Watch V3.1.x/4.1.x User Guide ( - Page 223
Table 39: End-to-End Performance Monitor-Class Threshold Defaults
 |
View all HP StorageWorks MSA 2/8 manuals
Add to My Manuals
Save this manual to your list of manuals |
Page 223 highlights
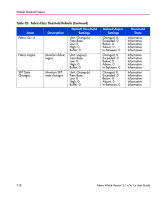
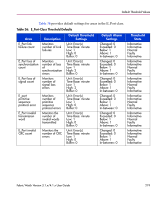
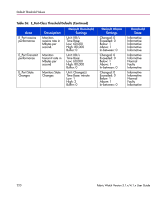
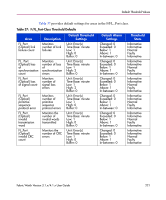
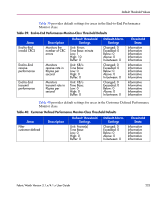
Default Threshold Values Table 39 provides default settings for areas in the End-to-End Performance Monitor class. Table 39: End-to-End Performance Monitor-Class Threshold Defaults Area End-to-End invalid CRCS End-to-End receive performance End-to-End transmit performance Description Monitors the number of CRC errors Monitors receive rate in Kbytes per second Monitors transmit rate in Kbytes per second Default Threshold Settings Unit: Errors Time Base: minute Low: 1 High: 10 Buffer: 0 Unit: KB/s Time Base: Low: 0 High: 0 Buffer: 0 Unit: KB/s Time Base: Low: 0 High: 0 Buffer: 0 Default Alarm Settings Changed: 0 Exceeded: 0 Below: 0 Above: 0 In-between: 0 Changed: 0 Exceeded: 0 Below: 0 Above: 0 In-between: 0 Changed: 0 Exceeded: 0 Below: 0 Above: 0 In-between: 0 Threshold State Informative Informative Informative Informative Informative Informative Informative Informative Informative Informative Informative Informative Informative Informative Informative Table 40 provides default settings for areas in the Customer Defined Performance Monitor class. Table 40: Customer Defined Performance Monitor-Class Threshold Defaults Area Filter customer-defined Description Default Threshold Settings Unit: Frame(s) Time Base: Low: 0 High: 0 Buffer: 0 Default Alarm Settings Changed: 0 Exceeded: 0 Below: 0 Above: 0 In-between: 0 Threshold State Informative Informative Informative Informative Informative Fabric Watch Version 3.1.x/4.1.x User Guide 223
-
 1
1 -
2
-
3
-
4
-
5
-
6
-
7
-
8
-
9
-
10
-
11
-
12
-
13
-
14
-
15
-
16
-
17
-
18
-
19
-
20
-
21
-
22
-
23
-
24
-
25
-
26
-
27
-
28
-
29
-
30
-
31
-
32
-
33
-
34
-
35
-
36
-
37
-
38
-
39
-
40
-
41
-
42
-
43
-
44
-
45
-
46
-
47
-
48
-
49
-
50
-
51
-
52
-
53
-
54
-
55
-
56
-
57
-
58
-
59
-
60
-
61
-
62
-
63
-
64
-
65
-
66
-
67
-
68
-
69
-
70
-
71
-
72
-
73
-
74
-
75
-
76
-
77
-
78
-
79
-
80
-
81
-
82
-
83
-
84
-
85
-
86
-
87
-
88
-
89
-
90
-
91
-
92
-
93
-
94
-
95
-
96
-
97
-
98
-
99
-
100
-
101
-
102
-
103
-
104
-
105
-
106
-
107
-
108
-
109
-
110
-
111
-
112
-
113
-
114
-
115
-
116
-
117
-
118
-
119
-
120
-
121
-
122
-
123
-
124
-
125
-
126
-
127
-
128
-
129
-
130
-
131
-
132
-
133
-
134
-
135
-
136
-
137
-
138
-
139
-
140
-
141
-
142
-
143
-
144
-
145
-
146
-
147
-
148
-
149
-
150
-
151
-
152
-
153
-
154
-
155
-
156
-
157
-
158
-
159
-
160
-
161
-
162
-
163
-
164
-
165
-
166
-
167
-
168
-
169
-
170
-
171
-
172
-
173
-
174
-
175
-
176
-
177
-
178
-
179
-
180
-
181
-
182
-
183
-
184
-
185
-
186
-
187
-
188
-
189
-
190
-
191
-
192
-
193
-
194
-
195
-
196
-
197
-
198
-
199
-
200
-
201
-
202
-
203
-
204
-
205
-
206
-
207
-
208
-
209
-
210
-
211
-
212
-
213
-
214
-
215
-
216
-
217
-
 218
218 -
 219
219 -
 220
220 -
 221
221 -
 222
222 -
 223
223 -
 224
224 -
 225
225 -
 226
226 -
 227
227 -
 228
228 -
229
-
230
-
231
-
232
-
233
-
234
-
235
-
236
-
237
-
238
-
239
-
240
-
241
-
242
-
243
-
244
-
245
-
246
-
247
-
248
-
249
-
250
-
251
-
252
-
253
-
254
-
255
-
256
-
257
-
258
-
259
-
260
-
261
-
262
-
263
-
264
-
265
-
266
-
267
 |
 |