HP BladeSystem bc2800 Administrator's Guide HP Session Allocation Manager (HP - Page 83
Filters, Display Options, Output Report, Minimum and Maximum Capacity graphs
 |
View all HP BladeSystem bc2800 manuals
Add to My Manuals
Save this manual to your list of manuals |
Page 83 highlights
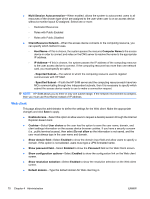
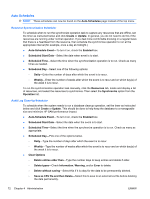
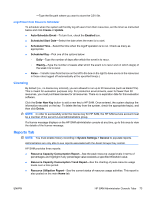
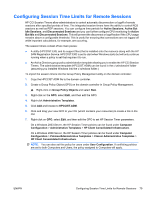
Filters ● Time Frame (From/To)-Narrow the data shown to the time period you are interested in ● Role Enabled-Narrow the data to all roles that are enabled only (Yes), disabled only (No), or ignore this flag by selecting both. ● Role Public-Narrow the data to all roles that have no user access list restriction (Yes), restricted access role (No), or ignore this flag by selecting both. ● Roles-See data for the selected roles only. If you choose this option, the system narrows the selection based on your previous selections above. Display Options ● Threshold Percentages-On the report you can highlight the data if it exceeds the number entered here. ◦ Minimum Available-If data is below the value entered, the report highlights it. ◦ Maximum Consumed-If data is above the value entered, the report highlights it. ● Time Interval-Chart the data where the scale is based on hour, day, week, or month. ● Include raw data-If the raw data is also wanted in the report, check the Include raw data box. ● Open in New Window-If selected, the result data are shown in a new browser window. Output Report ● Minimum and Maximum Capacity graphs-The graphs show the minimum number of blades available and the maximum number of blades used for the specified time period. In general, these values should add up to 100%. However, if a blade supports multiple roles, then the numbers will not add up because consuming a blade (which is in two or more roles) in one role will also decrease the minimum available in the other role. ● Time Interval-The time interval for which the report was run. This value is based on the selection in Display Options: Time Interval. ● Date-The date of the report. ● Role Name-Name of role. ● Minimum Available %-For the time period chosen, the peak value of minimum available is shown. This value indicates the percentage of computing resources that are still available for allocation dropped to this lowest value. ● Minimum Available-This value complements the percentage number above to show specifically how many resources within that role are still available. ● Maximum Consumed %-This value indicates the highest percentage of resources that were consumed during the time period chosen. ● Maximum Consumed-This value complements the percentage number above to show specifically how many resources within that role were consumed. ● Out of Resource-For the time period chosen, this value indicates how many times the system encountered the situation where there are not enough computing resources to fulfill the connection requests. ENWW HP SAM Administrator Console Tabs 75
-
 1
1 -
2
-
3
-
4
-
5
-
6
-
7
-
8
-
9
-
10
-
11
-
12
-
13
-
14
-
15
-
16
-
17
-
18
-
19
-
20
-
21
-
22
-
23
-
24
-
25
-
26
-
27
-
28
-
29
-
30
-
31
-
32
-
33
-
34
-
35
-
36
-
37
-
38
-
39
-
40
-
41
-
42
-
43
-
44
-
45
-
46
-
47
-
48
-
49
-
50
-
51
-
52
-
53
-
54
-
55
-
56
-
57
-
58
-
59
-
60
-
61
-
62
-
63
-
64
-
65
-
66
-
67
-
68
-
69
-
70
-
71
-
72
-
73
-
74
-
75
-
76
-
77
-
 78
78 -
 79
79 -
 80
80 -
 81
81 -
 82
82 -
 83
83 -
 84
84 -
 85
85 -
 86
86 -
 87
87 -
 88
88 -
89
-
90
-
91
-
92
-
93
-
94
-
95
-
96
-
97
-
98
-
99
-
100
-
101
-
102
-
103
-
104
 |
 |