HP BladeSystem bc2800 Administrator's Guide HP Session Allocation Manager (HP - Page 84
Resource Utilization Report, Filters, Display Options, Output Report, Log Tab
 |
View all HP BladeSystem bc2800 manuals
Add to My Manuals
Save this manual to your list of manuals |
Page 84 highlights
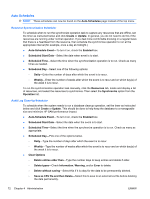
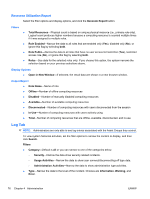
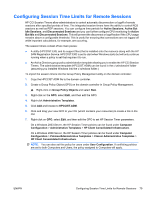
Resource Utilization Report Select the filter options and display options, and click the Generate Report button. Filters ● Total Resources-Physical count is based on unique physical resource (i.e., primary role only). Logical count produces higher numbers because a computing resource is counted multiple times if it was assigned to multiple roles. ● Role Enabled-Narrow the data to all roles that are enabled only (Yes), disabled only (No), or ignore this flag by selecting both. ● Role Public-Narrow the data to all roles that have no user access list restriction (Yes), restricted access role (No), or ignore this flag by selecting both. ● Roles-See data for the selected roles only. If you choose this option, the system narrows the selection based on your previous selections above. Display Options ● Open in New Window-If selected, the result data are shown in a new browser window. Output Report ● Role Name-Name of role. ● Offline-Number of offline computing resources ● Disabled-Number of manually disabled computing resources ● Available-Number of available computing resources ● Disconnected-Number of computing resources with users disconnected from the session ● In-Use-Number of computing resources with users actively using ● Total-Number of computing resources that are offline, available, disconnected, and in-use Log Tab NOTE: Administrators are only able to see log entries associated with the Asset Groups they control. To view system historical activities, set the filter options to narrow the content to display, and then click Search. Filters ● Category-Default is all or you can narrow to one of the categories below. ◦ Security-Narrow the data show security related incidents. ◦ Usage Activities-Narrow the data to show user connect/disconnect/log-off type data. ◦ Administration Activities-Narrow the data to show administration type activities. ● Type-Narrow the data to the level of the incident. Choices are Information, Warning, and Error. 76 Chapter 4 Administration ENWW
-
 1
1 -
2
-
3
-
4
-
5
-
6
-
7
-
8
-
9
-
10
-
11
-
12
-
13
-
14
-
15
-
16
-
17
-
18
-
19
-
20
-
21
-
22
-
23
-
24
-
25
-
26
-
27
-
28
-
29
-
30
-
31
-
32
-
33
-
34
-
35
-
36
-
37
-
38
-
39
-
40
-
41
-
42
-
43
-
44
-
45
-
46
-
47
-
48
-
49
-
50
-
51
-
52
-
53
-
54
-
55
-
56
-
57
-
58
-
59
-
60
-
61
-
62
-
63
-
64
-
65
-
66
-
67
-
68
-
69
-
70
-
71
-
72
-
73
-
74
-
75
-
76
-
77
-
78
-
 79
79 -
 80
80 -
 81
81 -
 82
82 -
 83
83 -
 84
84 -
 85
85 -
 86
86 -
 87
87 -
 88
88 -
 89
89 -
90
-
91
-
92
-
93
-
94
-
95
-
96
-
97
-
98
-
99
-
100
-
101
-
102
-
103
-
104
 |
 |