Intel BX80601920 Data Sheet - Page 73
Processor Thermal Profile, Table 6-2.
 |
UPC - 735858204736
View all Intel BX80601920 manuals
Add to My Manuals
Save this manual to your list of manuals |
Page 73 highlights
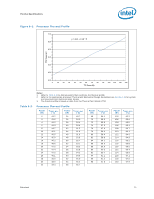
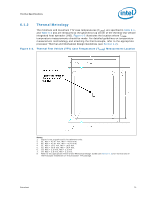
Thermal Specifications Figure 6-1. Processor Thermal Profile 70.0 y = 43.2 + 0.19 * P 65.0 60.0 TTV Tcase in C 55.0 50.0 45.0 40.0 0 10 20 30 40 50 60 70 80 90 100 110 120 130 TTV Power (W) Table 6-2. Notes: 1. Refer to Table 6-2 for discrete points that constitute the thermal profile. 2. Refer to the appropriate processor Thermal and Mechanical Design Guidelines (see Section 1.2) for system and environmental implementation details. 3. The thermal profile is based on data from the Thermal Test Vehicle (TTV). Processor Thermal Profile Power (W) 0 2 4 6 8 10 12 14 16 18 20 22 24 26 28 30 32 TCASE_MAX (C) 43.2 43.6 44.0 44.3 44.7 45.1 45.5 45.9 46.2 46.6 47.0 47.4 47.8 48.1 48.5 48.9 49.3 Power (W) 34 36 38 40 42 44 46 48 50 52 54 56 58 60 62 64 66 TCASE_MAX (C) 49.7 50.0 50.4 50.8 51.2 51.6 51.9 52.3 52.7 53.1 53.5 53.8 54.2 54.6 55.0 55.4 55.7 Power (W) 68 70 72 74 76 78 80 82 84 86 88 90 92 94 96 98 TCASE_MAX (C) 56.1 56.5 56.9 57.3 57.6 58.0 58.4 58.8 59.2 59.5 59.9 60.3 60.7 61.1 61.4 61.8 Power (W) 100 102 104 106 108 110 112 114 116 118 120 122 124 126 128 130 TCASE_MAX (C) 62.2 62.6 63.0 63.3 63.7 64.1 64.5 64.9 65.2 65.6 66.0 66.4 66.8 67.1 67.5 67.9 Datasheet 73
-
 1
1 -
2
-
3
-
4
-
5
-
6
-
7
-
8
-
9
-
10
-
11
-
12
-
13
-
14
-
15
-
16
-
17
-
18
-
19
-
20
-
21
-
22
-
23
-
24
-
25
-
26
-
27
-
28
-
29
-
30
-
31
-
32
-
33
-
34
-
35
-
36
-
37
-
38
-
39
-
40
-
41
-
42
-
43
-
44
-
45
-
46
-
47
-
48
-
49
-
50
-
51
-
52
-
53
-
54
-
55
-
56
-
57
-
58
-
59
-
60
-
61
-
62
-
63
-
64
-
65
-
66
-
67
-
 68
68 -
 69
69 -
 70
70 -
 71
71 -
 72
72 -
 73
73 -
 74
74 -
 75
75 -
 76
76 -
 77
77 -
 78
78 -
79
-
80
-
81
-
82
-
83
-
84
-
85
-
86
-
87
-
88
-
89
-
90
-
91
-
92
-
93
-
94
-
95
-
96
 |
 |
