HP 12C#ABA hp 12c_solutions handbook_English_E.pdf - Page 100
Statistics, Curve Fitting
 |
UPC - 492410746430
View all HP 12C#ABA manuals
Add to My Manuals
Save this manual to your list of manuals |
Page 100 highlights
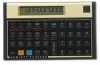
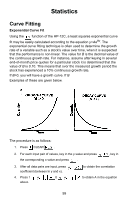
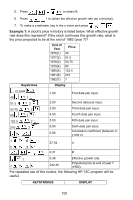
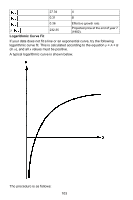
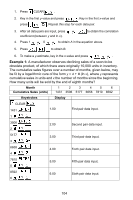
Statistics Curve Fitting Exponential Curve Fit Using the function of the HP-12C, a least squares exponential curve fit may be easily calculated according to the equation y=AeBx. The exponential curve fitting technique is often used to determine the growth rate of a variable such as a stock's value over time, when it is suspected that the performance is non-linear. The value for B is the decimal value of the continuous growth rate. For instance, assume after keying in several end-of-month price quotes for a particular stock it is determined that the value of B is 0.10. This means that over the measured growth period the stock has experienced a 10% continuous growth rate. If B>0, you will have a growth curve. If B Examples of these are given below. The procedure is as follows: 1. Press CLEAR . 2. For each input pair of values, key in the y-value and press the corresponding x-value and press . , key in 3. After all data pairs are input, press coefficient (between ln y and x). 4. Press 1 0 above. to obtain the correlation to obtain A in the equation 99
-
 1
1 -
2
-
3
-
4
-
5
-
6
-
7
-
8
-
9
-
10
-
11
-
12
-
13
-
14
-
15
-
16
-
17
-
18
-
19
-
20
-
21
-
22
-
23
-
24
-
25
-
26
-
27
-
28
-
29
-
30
-
31
-
32
-
33
-
34
-
35
-
36
-
37
-
38
-
39
-
40
-
41
-
42
-
43
-
44
-
45
-
46
-
47
-
48
-
49
-
50
-
51
-
52
-
53
-
54
-
55
-
56
-
57
-
58
-
59
-
60
-
61
-
62
-
63
-
64
-
65
-
66
-
67
-
68
-
69
-
70
-
71
-
72
-
73
-
74
-
75
-
76
-
77
-
78
-
79
-
80
-
81
-
82
-
83
-
84
-
85
-
86
-
87
-
88
-
89
-
90
-
91
-
92
-
93
-
94
-
 95
95 -
 96
96 -
 97
97 -
 98
98 -
 99
99 -
 100
100 -
 101
101 -
 102
102 -
 103
103 -
 104
104 -
 105
105 -
106
-
107
-
108
-
109
-
110
-
111
-
112
-
113
-
114
-
115
-
116
-
117
-
118
-
119
-
120
-
121
-
122
-
123
-
124
-
125
-
126
-
127
-
128
-
129
-
130
-
131
-
132
-
133
-
134
-
135
-
136
-
137
-
138
-
139
-
140
-
141
-
142
-
143
-
144
-
145
-
146
-
147
-
148
-
149
-
150
-
151
-
152
-
153
-
154
-
155
-
156
-
157
-
158
-
159
-
160
-
161
-
162
-
163
-
164
-
165
 |
 |