HP 12C#ABA hp 12c_solutions handbook_English_E.pdf - Page 108
Mean, Standard Deviation, Standard Error for Grouped Data
 |
UPC - 492410746430
View all HP 12C#ABA manuals
Add to My Manuals
Save this manual to your list of manuals |
Page 108 highlights
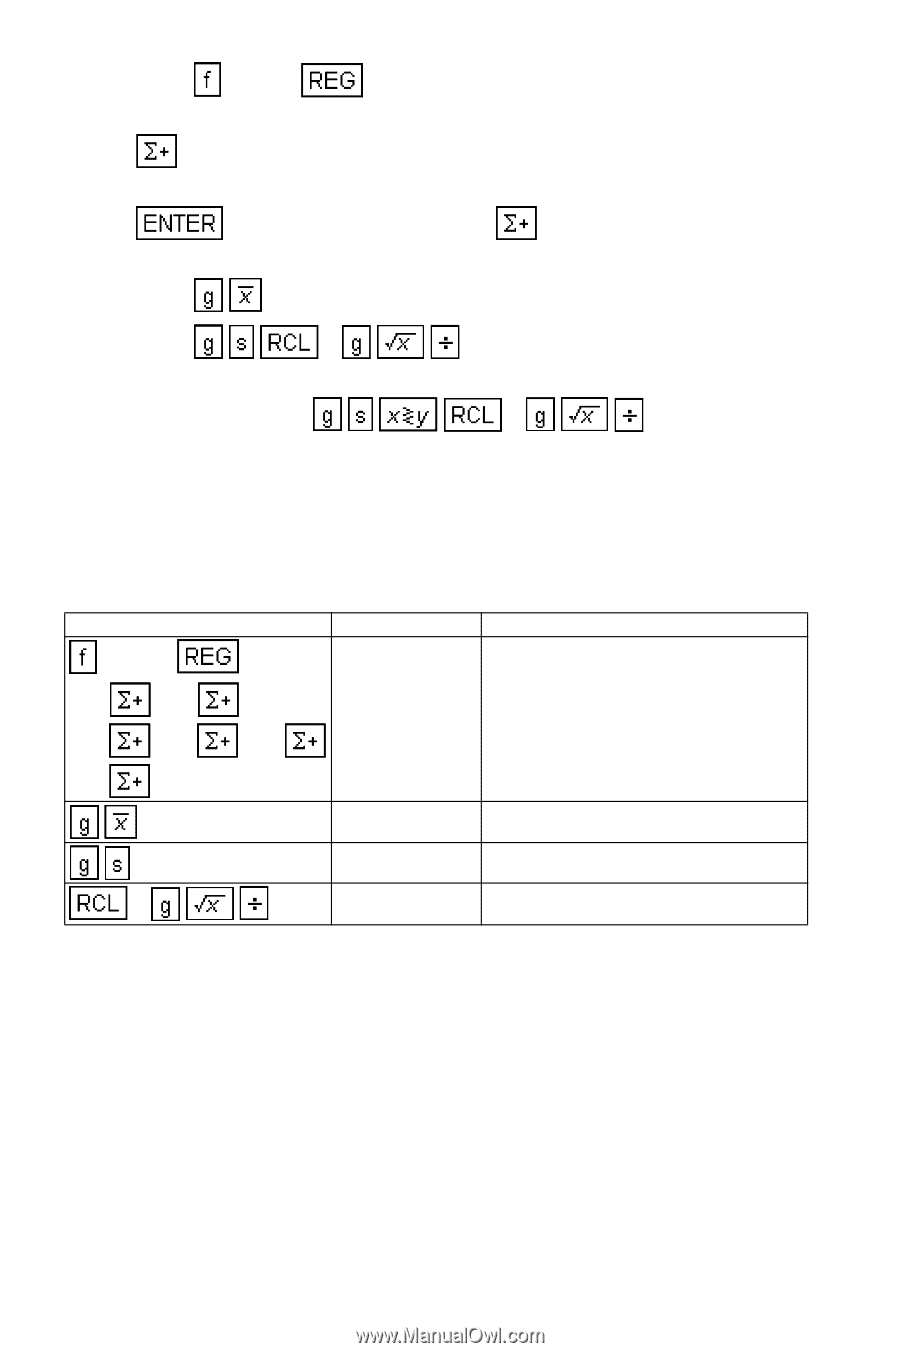
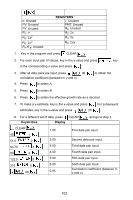
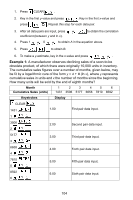
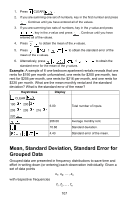
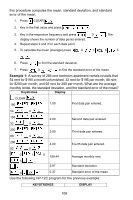
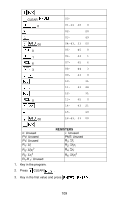
1. Press CLEAR . 2. If you are summing one set of numbers, key in the first number and press . Continue until you have entered all of the values. 3. If you are summing two sets of numbers, key in the y-value and press , key in the x-value and press . Continue until you have entered all of the values. 4. Press to obtain the mean of the x-values. 5. Press 1 mean of the x-values. to obtain the standard error of the 6. Alternatively, press 1 to obtain the standard error for the mean of the y-values. Example: A sample of 6 one-bedroom apartment rentals reveals that one rents for $190 per month unfurnished, one rents for $200 pre month, two rent for $205 per month, one rents for $216 per month, and one rents for $220 per month. What are the mean monthly rental and the standard deviation? What is the standard error of the mean? Keystrokes Display CLEAR 190 200 6.00 205 205 216 Total number of inputs. 220 206.00 Average monthly rent. 10.86 Standard deviation. 1 4.43 Standard error of the mean. Mean, Standard Deviation, Standard Error for Grouped Data Grouped data are presented in frequency distributions to save time and effort in writing down (or entering) each observation individually. Given a set of data points x1, x2, ... , xn with respective frequencies f1, f2, ... , fn 107
-
 1
1 -
2
-
3
-
4
-
5
-
6
-
7
-
8
-
9
-
10
-
11
-
12
-
13
-
14
-
15
-
16
-
17
-
18
-
19
-
20
-
21
-
22
-
23
-
24
-
25
-
26
-
27
-
28
-
29
-
30
-
31
-
32
-
33
-
34
-
35
-
36
-
37
-
38
-
39
-
40
-
41
-
42
-
43
-
44
-
45
-
46
-
47
-
48
-
49
-
50
-
51
-
52
-
53
-
54
-
55
-
56
-
57
-
58
-
59
-
60
-
61
-
62
-
63
-
64
-
65
-
66
-
67
-
68
-
69
-
70
-
71
-
72
-
73
-
74
-
75
-
76
-
77
-
78
-
79
-
80
-
81
-
82
-
83
-
84
-
85
-
86
-
87
-
88
-
89
-
90
-
91
-
92
-
93
-
94
-
95
-
96
-
97
-
98
-
99
-
100
-
101
-
102
-
 103
103 -
 104
104 -
 105
105 -
 106
106 -
 107
107 -
 108
108 -
 109
109 -
 110
110 -
 111
111 -
 112
112 -
 113
113 -
114
-
115
-
116
-
117
-
118
-
119
-
120
-
121
-
122
-
123
-
124
-
125
-
126
-
127
-
128
-
129
-
130
-
131
-
132
-
133
-
134
-
135
-
136
-
137
-
138
-
139
-
140
-
141
-
142
-
143
-
144
-
145
-
146
-
147
-
148
-
149
-
150
-
151
-
152
-
153
-
154
-
155
-
156
-
157
-
158
-
159
-
160
-
161
-
162
-
163
-
164
-
165
 |
 |