HP 12C#ABA hp 12c_solutions handbook_English_E.pdf - Page 107
Standard Error of the Mean
 |
UPC - 492410746430
View all HP 12C#ABA manuals
Add to My Manuals
Save this manual to your list of manuals |
Page 107 highlights
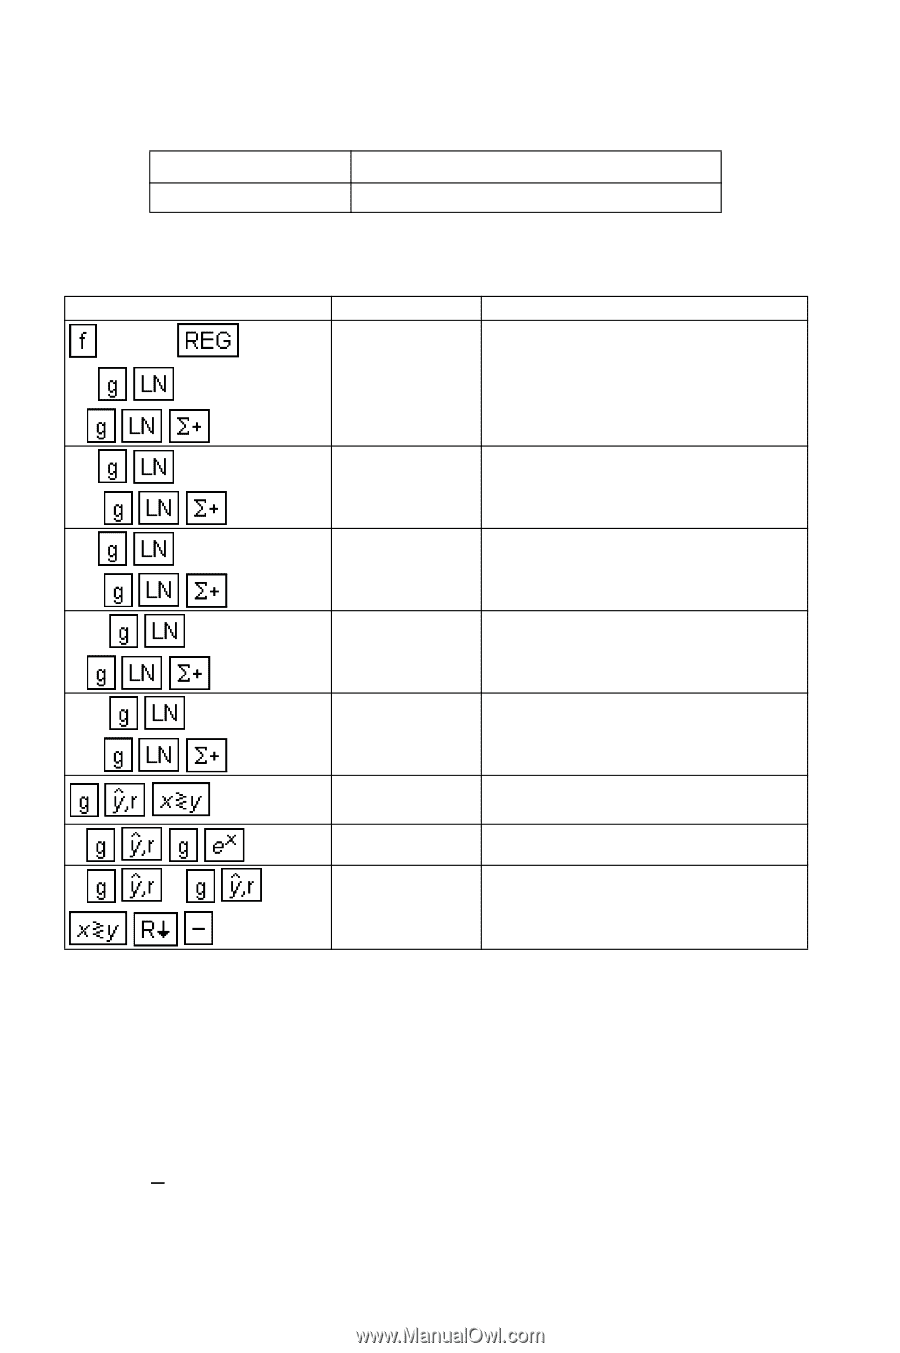
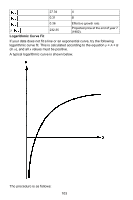
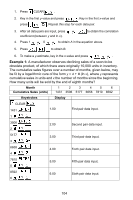
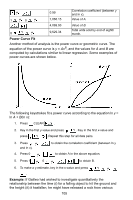
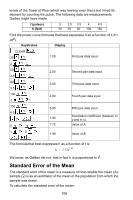
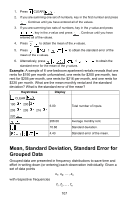
levels of the Tower of Pisa (which was leaning even then) and timed its descent by counting his pulse. The following data are measurements Galileo might have made. t (pulses) h (feet) 2 2.5 3.5 4 4.5 30 50 90 130 150 Find the power curve formulas that best expresses h as a function of t (h = AtB). Keystrokes Display CLEAR 30 1.00 First pair data input. 2 50 2.00 Second pair data input. 2.5 90 3.00 Third pair data input. 3.5 130 4.00 Fourth pair data input. 4 150 5.00 Fifth pair data input. 4.5 1.00 Correlation coefficient (between In y and ln x). 0 7.72 Value of A. 1 0 1.99 Value of B. The formula that best expresses h as a function of t is h = 7.72t1.99 We know, as Galileo did not, that in fact h is proportional to t2. Standard Error of the Mean The standard error of the mean is a measure of how reliable the mean of a sample (X) is as an estimator of the mean of the population from which the sample was drawn. To calculate the standard error of the mean: 106
-
 1
1 -
2
-
3
-
4
-
5
-
6
-
7
-
8
-
9
-
10
-
11
-
12
-
13
-
14
-
15
-
16
-
17
-
18
-
19
-
20
-
21
-
22
-
23
-
24
-
25
-
26
-
27
-
28
-
29
-
30
-
31
-
32
-
33
-
34
-
35
-
36
-
37
-
38
-
39
-
40
-
41
-
42
-
43
-
44
-
45
-
46
-
47
-
48
-
49
-
50
-
51
-
52
-
53
-
54
-
55
-
56
-
57
-
58
-
59
-
60
-
61
-
62
-
63
-
64
-
65
-
66
-
67
-
68
-
69
-
70
-
71
-
72
-
73
-
74
-
75
-
76
-
77
-
78
-
79
-
80
-
81
-
82
-
83
-
84
-
85
-
86
-
87
-
88
-
89
-
90
-
91
-
92
-
93
-
94
-
95
-
96
-
97
-
98
-
99
-
100
-
101
-
 102
102 -
 103
103 -
 104
104 -
 105
105 -
 106
106 -
 107
107 -
 108
108 -
 109
109 -
 110
110 -
 111
111 -
 112
112 -
113
-
114
-
115
-
116
-
117
-
118
-
119
-
120
-
121
-
122
-
123
-
124
-
125
-
126
-
127
-
128
-
129
-
130
-
131
-
132
-
133
-
134
-
135
-
136
-
137
-
138
-
139
-
140
-
141
-
142
-
143
-
144
-
145
-
146
-
147
-
148
-
149
-
150
-
151
-
152
-
153
-
154
-
155
-
156
-
157
-
158
-
159
-
160
-
161
-
162
-
163
-
164
-
165
 |
 |