HP 12C#ABA hp 12c_solutions handbook_English_E.pdf - Page 101
rate does this represent? If the stock continues this growth rate, what is - decimal display
 |
UPC - 492410746430
View all HP 12C#ABA manuals
Add to My Manuals
Save this manual to your list of manuals |
Page 101 highlights
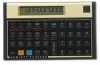
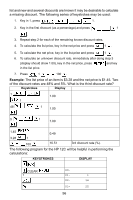
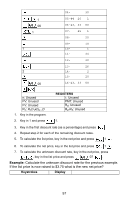
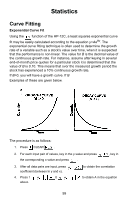
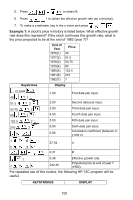
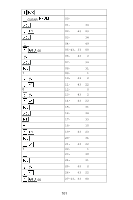
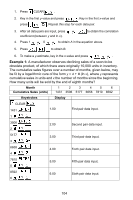
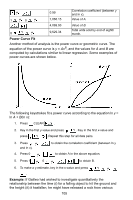
5. Press to obtain B. 6. Press 1 to obtain the effective growth rate (as a decimal). 7. To make a y-estimate, key in the x-value and press . Example 1: A stock's price in history is listed below. What effective growth rate does this represent? If the stock continues this growth rate, what is the price projected to be at the end of 1982 (year 7)? End of Year 1976(1) 1977(2) 1978(3) 1979(4) 1980(5) 1981(6) 1982(7) Price 45 51.5 53.75 80 122.5 210 ? Keystrokes Display CLEAR 45 1 51.5 2 53.75 2 80 2 122.5 2 210 2 1.00 First data pair input. 2.00 Second data pair input. 3.00 Third data pair input. 4.00 Fourth data pair input. 5.00 Fifth data pair input. 6.00 Sixth data pair input. 0.95 Correlation coefficient (between ln y and x). 1 27.34 A 0 0.31 B 1 7 0.36 232.35 Effective growth rate. Projected price at end of year 7 (1982). For repeated use of this routine, the following HP-12C program will be useful. KEYSTROKES DISPLAY 100
-
 1
1 -
2
-
3
-
4
-
5
-
6
-
7
-
8
-
9
-
10
-
11
-
12
-
13
-
14
-
15
-
16
-
17
-
18
-
19
-
20
-
21
-
22
-
23
-
24
-
25
-
26
-
27
-
28
-
29
-
30
-
31
-
32
-
33
-
34
-
35
-
36
-
37
-
38
-
39
-
40
-
41
-
42
-
43
-
44
-
45
-
46
-
47
-
48
-
49
-
50
-
51
-
52
-
53
-
54
-
55
-
56
-
57
-
58
-
59
-
60
-
61
-
62
-
63
-
64
-
65
-
66
-
67
-
68
-
69
-
70
-
71
-
72
-
73
-
74
-
75
-
76
-
77
-
78
-
79
-
80
-
81
-
82
-
83
-
84
-
85
-
86
-
87
-
88
-
89
-
90
-
91
-
92
-
93
-
94
-
95
-
 96
96 -
 97
97 -
 98
98 -
 99
99 -
 100
100 -
 101
101 -
 102
102 -
 103
103 -
 104
104 -
 105
105 -
 106
106 -
107
-
108
-
109
-
110
-
111
-
112
-
113
-
114
-
115
-
116
-
117
-
118
-
119
-
120
-
121
-
122
-
123
-
124
-
125
-
126
-
127
-
128
-
129
-
130
-
131
-
132
-
133
-
134
-
135
-
136
-
137
-
138
-
139
-
140
-
141
-
142
-
143
-
144
-
145
-
146
-
147
-
148
-
149
-
150
-
151
-
152
-
153
-
154
-
155
-
156
-
157
-
158
-
159
-
160
-
161
-
162
-
163
-
164
-
165
 |
 |
