HP 12C#ABA hp 12c_solutions handbook_English_E.pdf - Page 114
Normal Distribution
 |
UPC - 492410746430
View all HP 12C#ABA manuals
Add to My Manuals
Save this manual to your list of manuals |
Page 114 highlights
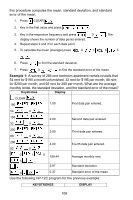
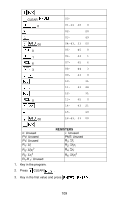
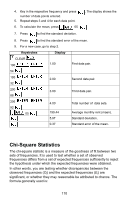
1. Key in the program. 2. Press CLEAR . 3. Key in the first Oi value and press . 4. Key in the first Ei value and press . 5. Repeat steps 3 and 4 for all data pairs. The x2 value is displayed. 6. For a new case, go to step 2. Keystrokes Display CLEAR 25 1.25 20 17 1.70 20 15 2.95 20 23 3.40 20 24 4.20 20 16 5.00 X2 20 Normal Distribution The normal (or Gaussian) distribution is an important tool in statistics and business analysis. The following HP-12C program gives an approximation to the upper tail area Q under a standardized normal distribution curve, given x. The upper tail area signifies the probability of occurrence of all values ≥x. 113
-
 1
1 -
2
-
3
-
4
-
5
-
6
-
7
-
8
-
9
-
10
-
11
-
12
-
13
-
14
-
15
-
16
-
17
-
18
-
19
-
20
-
21
-
22
-
23
-
24
-
25
-
26
-
27
-
28
-
29
-
30
-
31
-
32
-
33
-
34
-
35
-
36
-
37
-
38
-
39
-
40
-
41
-
42
-
43
-
44
-
45
-
46
-
47
-
48
-
49
-
50
-
51
-
52
-
53
-
54
-
55
-
56
-
57
-
58
-
59
-
60
-
61
-
62
-
63
-
64
-
65
-
66
-
67
-
68
-
69
-
70
-
71
-
72
-
73
-
74
-
75
-
76
-
77
-
78
-
79
-
80
-
81
-
82
-
83
-
84
-
85
-
86
-
87
-
88
-
89
-
90
-
91
-
92
-
93
-
94
-
95
-
96
-
97
-
98
-
99
-
100
-
101
-
102
-
103
-
104
-
105
-
106
-
107
-
108
-
 109
109 -
 110
110 -
 111
111 -
 112
112 -
 113
113 -
 114
114 -
 115
115 -
 116
116 -
 117
117 -
 118
118 -
 119
119 -
120
-
121
-
122
-
123
-
124
-
125
-
126
-
127
-
128
-
129
-
130
-
131
-
132
-
133
-
134
-
135
-
136
-
137
-
138
-
139
-
140
-
141
-
142
-
143
-
144
-
145
-
146
-
147
-
148
-
149
-
150
-
151
-
152
-
153
-
154
-
155
-
156
-
157
-
158
-
159
-
160
-
161
-
162
-
163
-
164
-
165
 |
 |
113
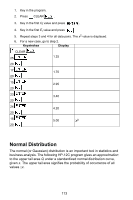
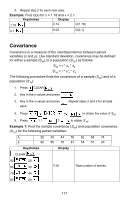
1.
Key in the program.
2.
Press
CLEAR
3.
Key in the first
O
i
value and press
4.
Key in the first
E
i
value and press
5.
Repeat steps 3 and 4 for all data pairs. The
x
2
value is displayed.
6.
For a new case, go to step 2.
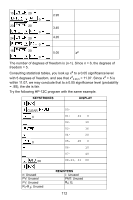
Normal Distribution
The normal (or Gaussian) distribution is an important tool in statistics and
business analysis. The following HP-12C program gives an
approximation
to the upper tail area
Q
under a standardized normal distribution curve,
given
x
. The upper tail area signifies the probability of occurrence of all
values
≥
x
.
Keystrokes
Display
CLEAR
25
20
1.25
17
20
1.70
15
20
2.95
23
20
3.40
24
20
4.20
16
20
5.00
X
2