HP 12C#ABA hp 12c_solutions handbook_English_E.pdf - Page 88
Forecasting with Exponential Smoothing
 |
UPC - 492410746430
View all HP 12C#ABA manuals
Add to My Manuals
Save this manual to your list of manuals |
Page 88 highlights
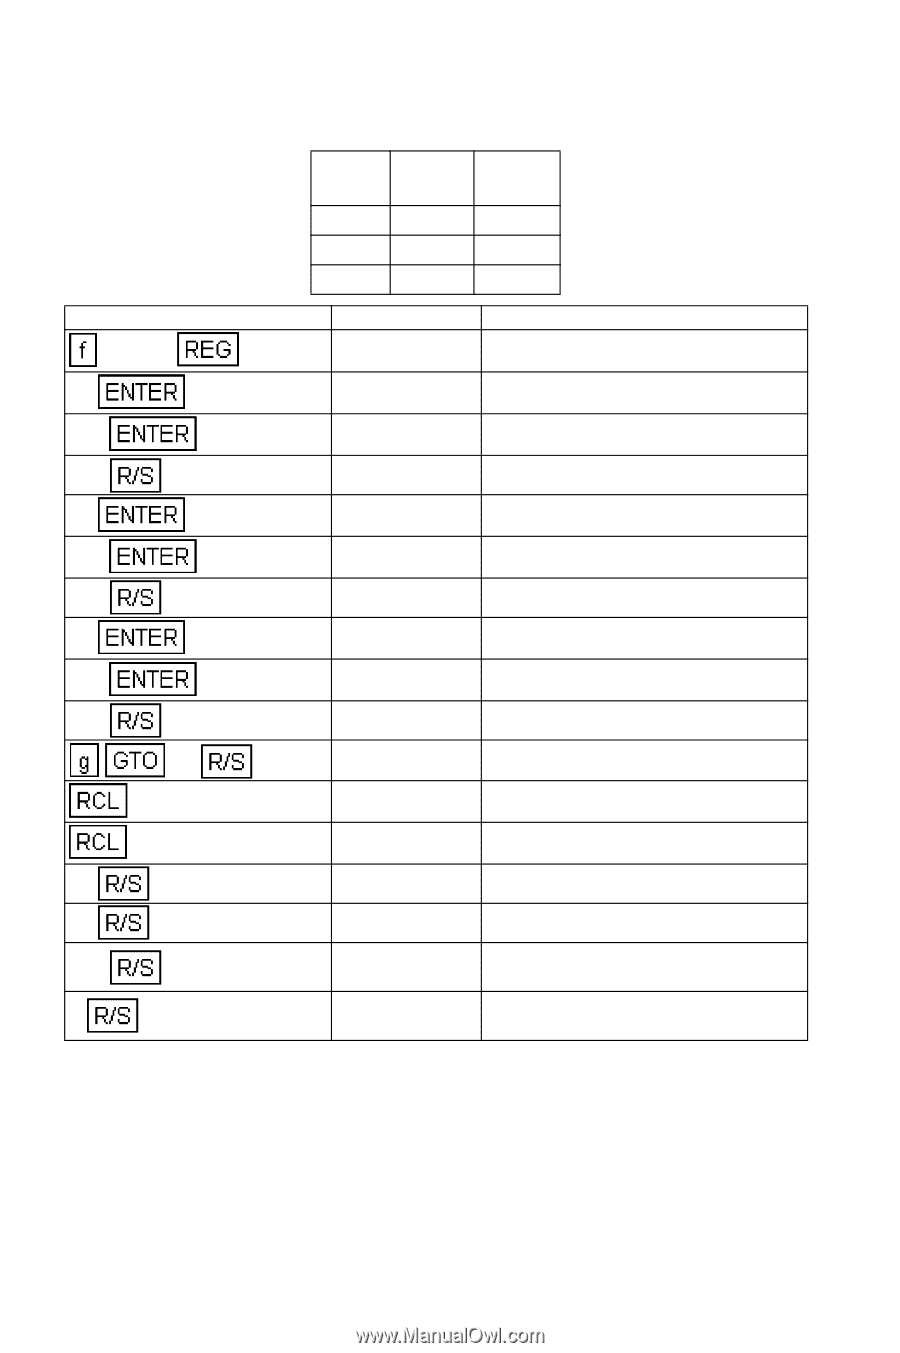
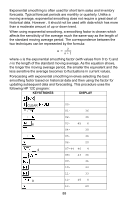
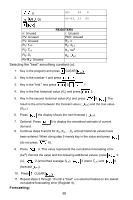
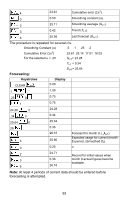
present trend continues? What annual sales rate would the curve have predicted for the 5th year of the product's life? (Arrange the data as follows:) Group Group Group I II III 18 151 282 41 188 322 49 260 340 Keystrokes CLEAR 18 151 282 41 188 322 49 260 340 13 6 7 10 12 100 5 Display 0.00 18.00 151.00 1.00 41.00 188.00 2.00 49.00 260.00 3.00 0.004 0.65 373.92 349.09 363.36 373.92 202.60 Total number of entries. a b c Sales in 10th year, (in $K). Sales in 12th year, (in $K). Maximum annual sales (after very long product life). Sales in 5th year (actual sales were $188K). Forecasting with Exponential Smoothing A common method for analyzing trends in sales, inventory and securities is the moving average. Exponential smoothing is a version of the weighted moving average which is readily adaptable to programmable calculator forecasting. 87
-
 1
1 -
2
-
3
-
4
-
5
-
6
-
7
-
8
-
9
-
10
-
11
-
12
-
13
-
14
-
15
-
16
-
17
-
18
-
19
-
20
-
21
-
22
-
23
-
24
-
25
-
26
-
27
-
28
-
29
-
30
-
31
-
32
-
33
-
34
-
35
-
36
-
37
-
38
-
39
-
40
-
41
-
42
-
43
-
44
-
45
-
46
-
47
-
48
-
49
-
50
-
51
-
52
-
53
-
54
-
55
-
56
-
57
-
58
-
59
-
60
-
61
-
62
-
63
-
64
-
65
-
66
-
67
-
68
-
69
-
70
-
71
-
72
-
73
-
74
-
75
-
76
-
77
-
78
-
79
-
80
-
81
-
82
-
 83
83 -
 84
84 -
 85
85 -
 86
86 -
 87
87 -
 88
88 -
 89
89 -
 90
90 -
 91
91 -
 92
92 -
 93
93 -
94
-
95
-
96
-
97
-
98
-
99
-
100
-
101
-
102
-
103
-
104
-
105
-
106
-
107
-
108
-
109
-
110
-
111
-
112
-
113
-
114
-
115
-
116
-
117
-
118
-
119
-
120
-
121
-
122
-
123
-
124
-
125
-
126
-
127
-
128
-
129
-
130
-
131
-
132
-
133
-
134
-
135
-
136
-
137
-
138
-
139
-
140
-
141
-
142
-
143
-
144
-
145
-
146
-
147
-
148
-
149
-
150
-
151
-
152
-
153
-
154
-
155
-
156
-
157
-
158
-
159
-
160
-
161
-
162
-
163
-
164
-
165
 |
 |