HP 12C#ABA hp 12c_solutions handbook_English_E.pdf - Page 111
Chi-Square Statistics - standard deviation
 |
UPC - 492410746430
View all HP 12C#ABA manuals
Add to My Manuals
Save this manual to your list of manuals |
Page 111 highlights
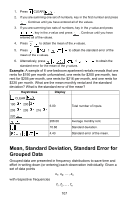
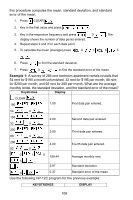
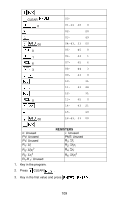
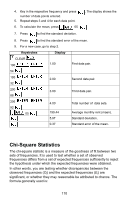
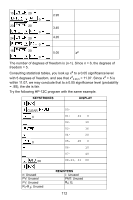
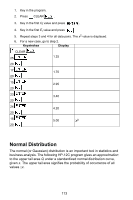
4. Key in the respective frequency and press number of data points entered. 5. Repeat steps 3 and 4 for each data point. 6. To calculate the mean, press 05 . The display shows the . 7. Press to find the standard deviation. 8. Press to find the standard error of the mean. 9. For a new case, go to step 2. Keystrokes Display CLEAR 190 1.00 First data pair. 54 195 2.00 Second data pair. 32 200 3.00 Third data pair. 88 206 92 05 4.00 199.44 5.97 Total number of data sets. Average monthly rent (maen). Standard deviation. 0.37 Standard error of the mean. Chi-Square Statistics The chi-square statistic is a measure of the goodness of fit between two sets of frequencies. It is used to test whether a set of observed frequencies differs from a set of expected frequencies sufficiently to reject the hypothesis under which the expected frequencies were obtained. In other words, you are testing whether discrepancies between the observed frequencies (Oi) and the expected frequencies (Ei) are significant, or whether they may reasonable be attributed to chance. The formula generally used is: 110
-
 1
1 -
2
-
3
-
4
-
5
-
6
-
7
-
8
-
9
-
10
-
11
-
12
-
13
-
14
-
15
-
16
-
17
-
18
-
19
-
20
-
21
-
22
-
23
-
24
-
25
-
26
-
27
-
28
-
29
-
30
-
31
-
32
-
33
-
34
-
35
-
36
-
37
-
38
-
39
-
40
-
41
-
42
-
43
-
44
-
45
-
46
-
47
-
48
-
49
-
50
-
51
-
52
-
53
-
54
-
55
-
56
-
57
-
58
-
59
-
60
-
61
-
62
-
63
-
64
-
65
-
66
-
67
-
68
-
69
-
70
-
71
-
72
-
73
-
74
-
75
-
76
-
77
-
78
-
79
-
80
-
81
-
82
-
83
-
84
-
85
-
86
-
87
-
88
-
89
-
90
-
91
-
92
-
93
-
94
-
95
-
96
-
97
-
98
-
99
-
100
-
101
-
102
-
103
-
104
-
105
-
 106
106 -
 107
107 -
 108
108 -
 109
109 -
 110
110 -
 111
111 -
 112
112 -
 113
113 -
 114
114 -
 115
115 -
 116
116 -
117
-
118
-
119
-
120
-
121
-
122
-
123
-
124
-
125
-
126
-
127
-
128
-
129
-
130
-
131
-
132
-
133
-
134
-
135
-
136
-
137
-
138
-
139
-
140
-
141
-
142
-
143
-
144
-
145
-
146
-
147
-
148
-
149
-
150
-
151
-
152
-
153
-
154
-
155
-
156
-
157
-
158
-
159
-
160
-
161
-
162
-
163
-
164
-
165
 |
 |
