HP 12C#ABA hp 12c_solutions handbook_English_E.pdf - Page 149
Example 3, What is the probability that a customer will have to wait 2 minutes or
 |
UPC - 492410746430
View all HP 12C#ABA manuals
Add to My Manuals
Save this manual to your list of manuals |
Page 149 highlights
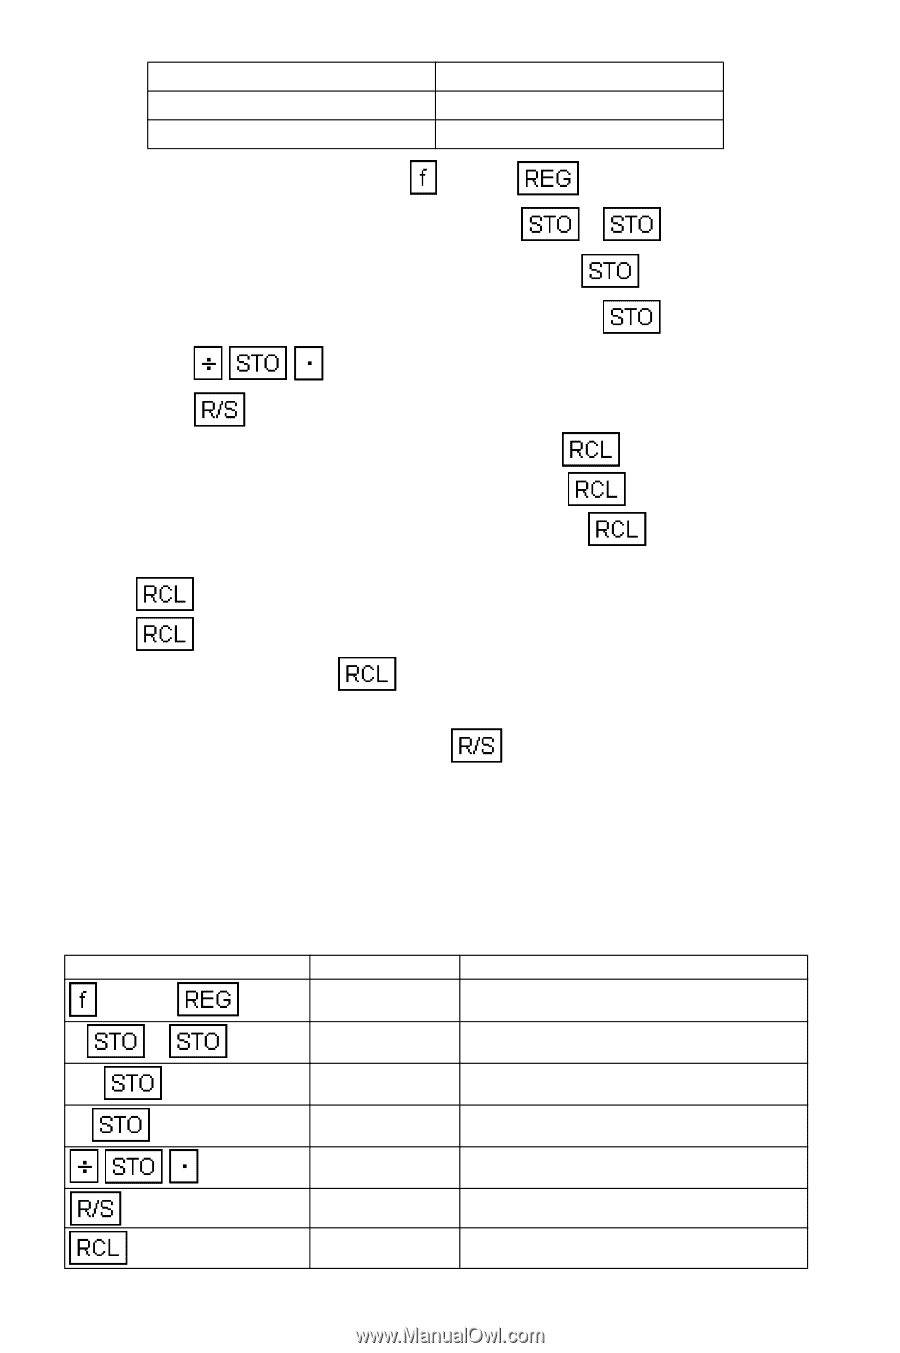
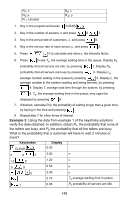
R7: n R9: µ R.1: Unused R8: λ R.0: ρ 1. Key in the program and press CLEAR . 2. Key in the number of servers, n and press 0 7. 3. Key in the arrival rate of customers, λ, and press 8. 4. Key in the service rate of each server, µ, and press 9. 5. Press 0 to calculate and store ρ, the intensity factor. 6. Press to see Tq, the average waiting time in the queue. Display P0, probability that all servers are idle, by pressing 1. Display Pb, probability that all servers are busy by pressing 2. Display Lq, average number waiting in the queue by pressing 3. Display L, the average number in the system (waiting and being served), by pressing 4. Display T, average total time through the system, by pressing 5. Tq, the average waiting time in the queue, may again be displayed by pressing 6. 7. If desired, calculate P(t), the probability of waiting longer than a given time, by keying in the time and pressing . 8. Repeat step 7 for other times of interest. Example 3: Using the data from example 1 of the keystroke solutions verify the data obtained. In addition, obtain P0, the probability that none of the tellers are busy, and Pb the probability that all the tellers are busy. What is the probability that a customer will have to wait 2 minutes or more? Keystrokes Display CLEAR 0.00 3 0 7 3.00 n 1.2 8 1.20 λ .5 9 0.50 µ 0 2.40 2.16 ρ Tq average waiting time in queue. 1 0.06 P0 probability all servers are idle. 148
-
 1
1 -
2
-
3
-
4
-
5
-
6
-
7
-
8
-
9
-
10
-
11
-
12
-
13
-
14
-
15
-
16
-
17
-
18
-
19
-
20
-
21
-
22
-
23
-
24
-
25
-
26
-
27
-
28
-
29
-
30
-
31
-
32
-
33
-
34
-
35
-
36
-
37
-
38
-
39
-
40
-
41
-
42
-
43
-
44
-
45
-
46
-
47
-
48
-
49
-
50
-
51
-
52
-
53
-
54
-
55
-
56
-
57
-
58
-
59
-
60
-
61
-
62
-
63
-
64
-
65
-
66
-
67
-
68
-
69
-
70
-
71
-
72
-
73
-
74
-
75
-
76
-
77
-
78
-
79
-
80
-
81
-
82
-
83
-
84
-
85
-
86
-
87
-
88
-
89
-
90
-
91
-
92
-
93
-
94
-
95
-
96
-
97
-
98
-
99
-
100
-
101
-
102
-
103
-
104
-
105
-
106
-
107
-
108
-
109
-
110
-
111
-
112
-
113
-
114
-
115
-
116
-
117
-
118
-
119
-
120
-
121
-
122
-
123
-
124
-
125
-
126
-
127
-
128
-
129
-
130
-
131
-
132
-
133
-
134
-
135
-
136
-
137
-
138
-
139
-
140
-
141
-
142
-
143
-
 144
144 -
 145
145 -
 146
146 -
 147
147 -
 148
148 -
 149
149 -
 150
150 -
 151
151 -
 152
152 -
 153
153 -
 154
154 -
155
-
156
-
157
-
158
-
159
-
160
-
161
-
162
-
163
-
164
-
165
 |
 |