HP 12C#ABA hp 12c_solutions handbook_English_E.pdf - Page 106
Power Curve Fit, Example, relationship between the time
 |
UPC - 492410746430
View all HP 12C#ABA manuals
Add to My Manuals
Save this manual to your list of manuals |
Page 106 highlights
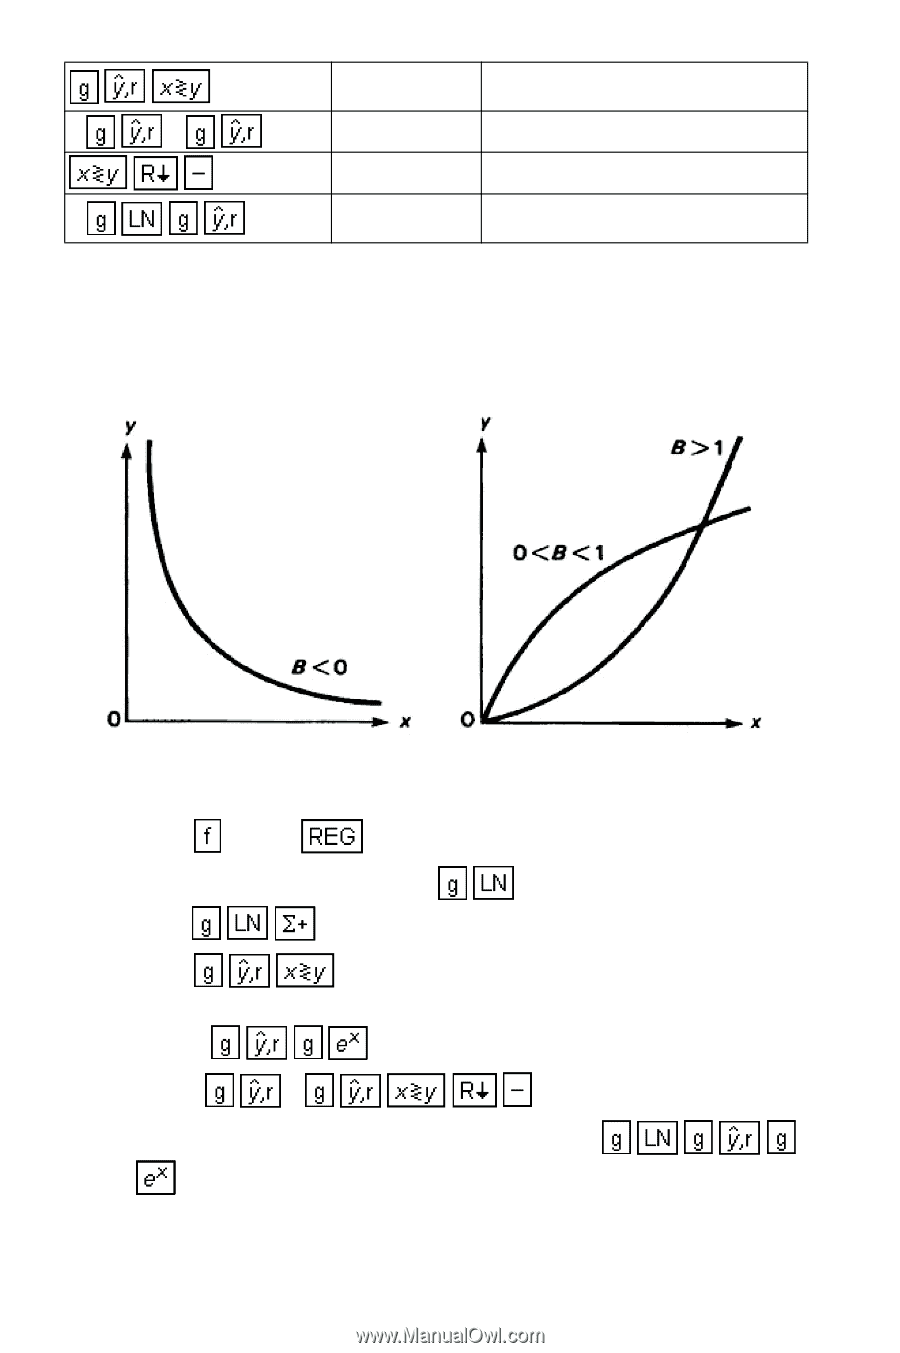
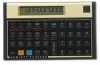
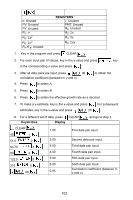
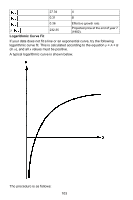
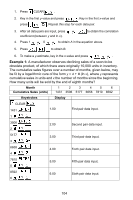
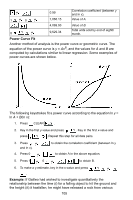
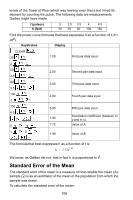
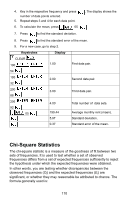
0.99 Correlation coefficient (between y and ln x). 1 0 1,066.15 Value of A. 4,069.93 Value of B. 8 9,529.34 Total units sold by end of eighth month. Power Curve Fit Another method of analysis is the power curve or geometric curve. The equation of the power curve is y = AxB, and the values for A and B are computed by calculations similar to linear regression. Some examples of power curves are shown below. The following keystrokes fit a power curve according to the equation ln y = ln A + B(ln x): 1. Press CLEAR . 2. Key in the first y-value and press . Key in the first x-value and press . Repeat this step for all data pairs. 3. Press and ln x). 4. Press 0 , to obtain the correlation coefficient (between ln y to obtain A in the above equation. 5. Press 1 0 to obtain B. 6. To make a y-estimate, key in the x-value and press . Example: If Galileo had wished to investigate quantitatively the relationship between the time (t) for a falling object to hit the ground and the height (h) it hasfallen, he might have released a rock from various 105
-
 1
1 -
2
-
3
-
4
-
5
-
6
-
7
-
8
-
9
-
10
-
11
-
12
-
13
-
14
-
15
-
16
-
17
-
18
-
19
-
20
-
21
-
22
-
23
-
24
-
25
-
26
-
27
-
28
-
29
-
30
-
31
-
32
-
33
-
34
-
35
-
36
-
37
-
38
-
39
-
40
-
41
-
42
-
43
-
44
-
45
-
46
-
47
-
48
-
49
-
50
-
51
-
52
-
53
-
54
-
55
-
56
-
57
-
58
-
59
-
60
-
61
-
62
-
63
-
64
-
65
-
66
-
67
-
68
-
69
-
70
-
71
-
72
-
73
-
74
-
75
-
76
-
77
-
78
-
79
-
80
-
81
-
82
-
83
-
84
-
85
-
86
-
87
-
88
-
89
-
90
-
91
-
92
-
93
-
94
-
95
-
96
-
97
-
98
-
99
-
100
-
 101
101 -
 102
102 -
 103
103 -
 104
104 -
 105
105 -
 106
106 -
 107
107 -
 108
108 -
 109
109 -
 110
110 -
 111
111 -
112
-
113
-
114
-
115
-
116
-
117
-
118
-
119
-
120
-
121
-
122
-
123
-
124
-
125
-
126
-
127
-
128
-
129
-
130
-
131
-
132
-
133
-
134
-
135
-
136
-
137
-
138
-
139
-
140
-
141
-
142
-
143
-
144
-
145
-
146
-
147
-
148
-
149
-
150
-
151
-
152
-
153
-
154
-
155
-
156
-
157
-
158
-
159
-
160
-
161
-
162
-
163
-
164
-
165
 |
 |