HP 12C#ABA hp 12c_solutions handbook_English_E.pdf - Page 87
Example, The X-presso Company marked a revolutionary new coffee
 |
UPC - 492410746430
View all HP 12C#ABA manuals
Add to My Manuals
Save this manual to your list of manuals |
Page 87 highlights
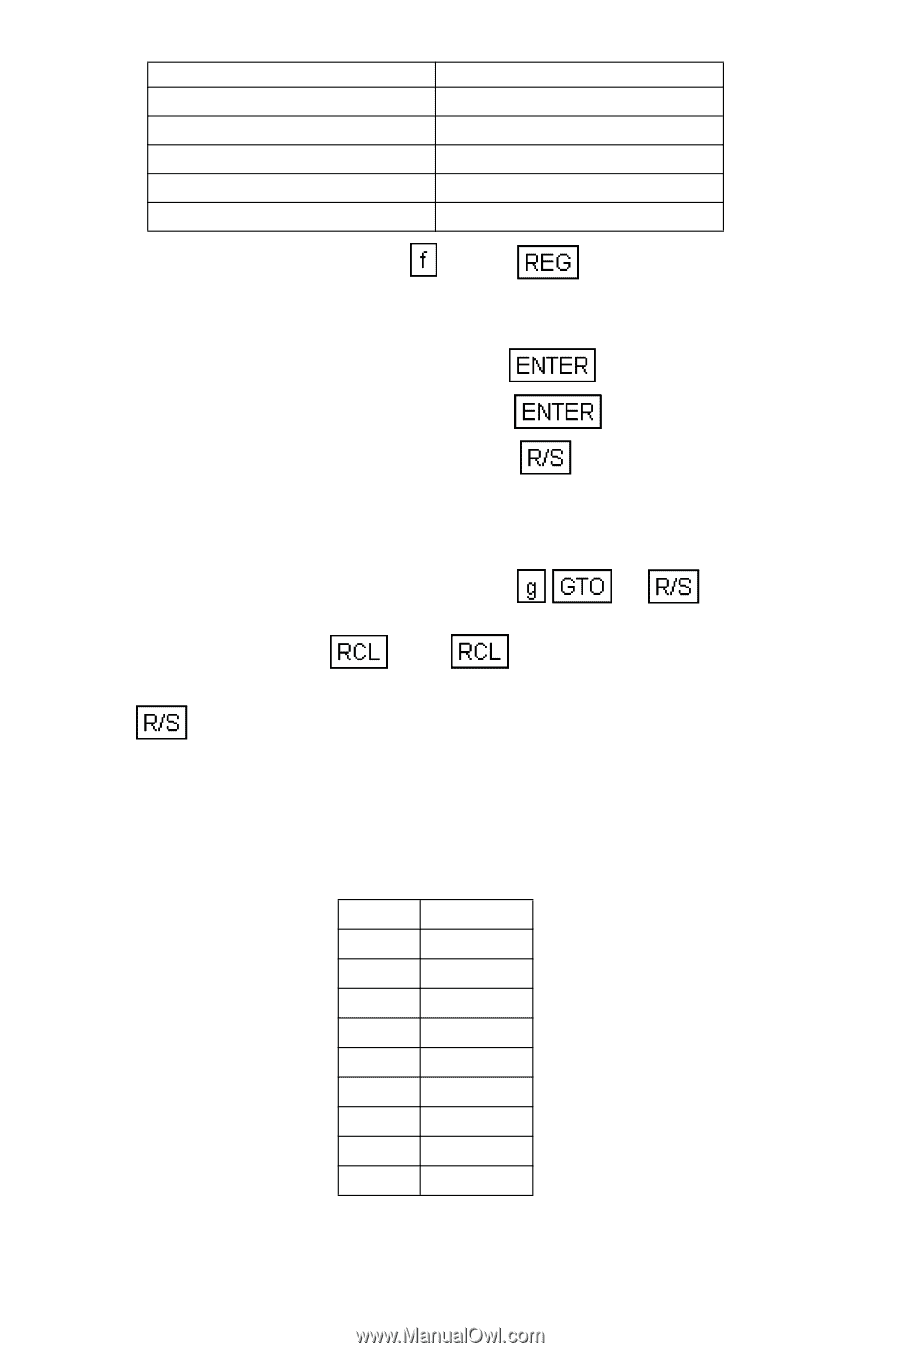
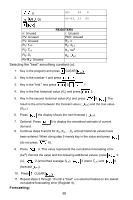
PV: Unused FV: Unused R1: S1 R3: S3 R5: a R7: c PMT: Unused R0: Unused R2: S2 R4: n R6: b R8-R.0: Unused 1. Key in the program and press CLEAR . 2. Divide the data points to be input into 3 equal consecutive groups. Label them Groups I, II and III for convenience. 3. Key in the first point of group I and press . 4. Key in the first point of group II and press . 5. Key in the first point of group III and press . 6. Repeat steps 3, 4, and 5 for the balance of the data in each group. After executing step 5 the display shows how many sets of data have been entered. 7. To fit the data to a Gompertz curve, press 12 . The resultant display is the curve constant "a". Constants "b" and "c" may be obtained by pressing 6 and 7 respectively. 8. To calculate a projected value, key in the number of the period and press . 9. Repeat step 8 for each period desired. Example: The X-presso Company marked a revolutionary new coffee brewing machine in 1968. Sales grew at a steady pace for several years, then began to slow. The sales records for the first 9 years of the product's life were as follows. Year 1 2 3 4 5 6 7 8 9 Sales($K) 18 41 49 151 188 260 282 322 340 What are the projected sales volumes for this product in its 10th and 12th year?What is the maximum yearly sales volume for this product if the 86
-
 1
1 -
2
-
3
-
4
-
5
-
6
-
7
-
8
-
9
-
10
-
11
-
12
-
13
-
14
-
15
-
16
-
17
-
18
-
19
-
20
-
21
-
22
-
23
-
24
-
25
-
26
-
27
-
28
-
29
-
30
-
31
-
32
-
33
-
34
-
35
-
36
-
37
-
38
-
39
-
40
-
41
-
42
-
43
-
44
-
45
-
46
-
47
-
48
-
49
-
50
-
51
-
52
-
53
-
54
-
55
-
56
-
57
-
58
-
59
-
60
-
61
-
62
-
63
-
64
-
65
-
66
-
67
-
68
-
69
-
70
-
71
-
72
-
73
-
74
-
75
-
76
-
77
-
78
-
79
-
80
-
81
-
 82
82 -
 83
83 -
 84
84 -
 85
85 -
 86
86 -
 87
87 -
 88
88 -
 89
89 -
 90
90 -
 91
91 -
 92
92 -
93
-
94
-
95
-
96
-
97
-
98
-
99
-
100
-
101
-
102
-
103
-
104
-
105
-
106
-
107
-
108
-
109
-
110
-
111
-
112
-
113
-
114
-
115
-
116
-
117
-
118
-
119
-
120
-
121
-
122
-
123
-
124
-
125
-
126
-
127
-
128
-
129
-
130
-
131
-
132
-
133
-
134
-
135
-
136
-
137
-
138
-
139
-
140
-
141
-
142
-
143
-
144
-
145
-
146
-
147
-
148
-
149
-
150
-
151
-
152
-
153
-
154
-
155
-
156
-
157
-
158
-
159
-
160
-
161
-
162
-
163
-
164
-
165
 |
 |