HP 12C#ABA hp 12c_solutions handbook_English_E.pdf - Page 53
Break-Even Analysis - basics
 |
UPC - 492410746430
View all HP 12C#ABA manuals
Add to My Manuals
Save this manual to your list of manuals |
Page 53 highlights
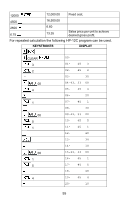
200 1700 200 1700 200 1700 200 1700 300 0 300 0 750 1 3 43 2 -628.09 5th year. -226.44 6th year. -309.48 7th year. -388.81 -1,034.72 -1,080.88 750.00 390.00 239.43 -150.49 8th year. 9th year. 10th year. Buy back. After tax buy back expense. Present value. Net lease advantage. Break-Even Analysis Break-even analysis is basically a technique for analyzing the relationships among fixed costs, variable costs, and income. Until the break even point is reached at the intersection of the total income and total cost lines, the producer operates at a loss. After the break-even point each unit produced and sold makes a profit. Break even analysis may be represented as follows. 52
-
 1
1 -
2
-
3
-
4
-
5
-
6
-
7
-
8
-
9
-
10
-
11
-
12
-
13
-
14
-
15
-
16
-
17
-
18
-
19
-
20
-
21
-
22
-
23
-
24
-
25
-
26
-
27
-
28
-
29
-
30
-
31
-
32
-
33
-
34
-
35
-
36
-
37
-
38
-
39
-
40
-
41
-
42
-
43
-
44
-
45
-
46
-
47
-
 48
48 -
 49
49 -
 50
50 -
 51
51 -
 52
52 -
 53
53 -
 54
54 -
 55
55 -
 56
56 -
 57
57 -
 58
58 -
59
-
60
-
61
-
62
-
63
-
64
-
65
-
66
-
67
-
68
-
69
-
70
-
71
-
72
-
73
-
74
-
75
-
76
-
77
-
78
-
79
-
80
-
81
-
82
-
83
-
84
-
85
-
86
-
87
-
88
-
89
-
90
-
91
-
92
-
93
-
94
-
95
-
96
-
97
-
98
-
99
-
100
-
101
-
102
-
103
-
104
-
105
-
106
-
107
-
108
-
109
-
110
-
111
-
112
-
113
-
114
-
115
-
116
-
117
-
118
-
119
-
120
-
121
-
122
-
123
-
124
-
125
-
126
-
127
-
128
-
129
-
130
-
131
-
132
-
133
-
134
-
135
-
136
-
137
-
138
-
139
-
140
-
141
-
142
-
143
-
144
-
145
-
146
-
147
-
148
-
149
-
150
-
151
-
152
-
153
-
154
-
155
-
156
-
157
-
158
-
159
-
160
-
161
-
162
-
163
-
164
-
165
 |
 |
52
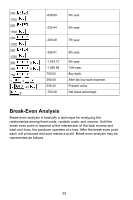
Break-Even Analysis
Break-even analysis is basically a technique for analyzing the
relationships among fixed costs, variable costs, and income. Until the
break even point is reached at the intersection of the total income and
total cost lines, the producer operates at a loss. After the break-even point
each unit produced and sold makes a profit. Break even analysis may be
represented as follows.
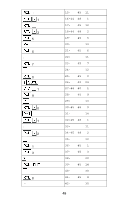
200
1700
-628.09
5th year.
200
1700
-226.44
6th year.
200
1700
-309.48
7th year.
200
1700
-388.81
8th year.
300
0
-1,034.72
9th year.
300
0
-1,080.88
10th year.
750
750.00
Buy back.
1
3
390.00
After tax buy back expense.
43
239.43
Present value.
2
-150.49
Net lease advantage.