HP 12C#ABA hp 12c_solutions handbook_English_E.pdf - Page 145
Example 1, Richard E Trueman, An Introduction to Quantitative Methods for Decision
 |
UPC - 492410746430
View all HP 12C#ABA manuals
Add to My Manuals
Save this manual to your list of manuals |
Page 145 highlights
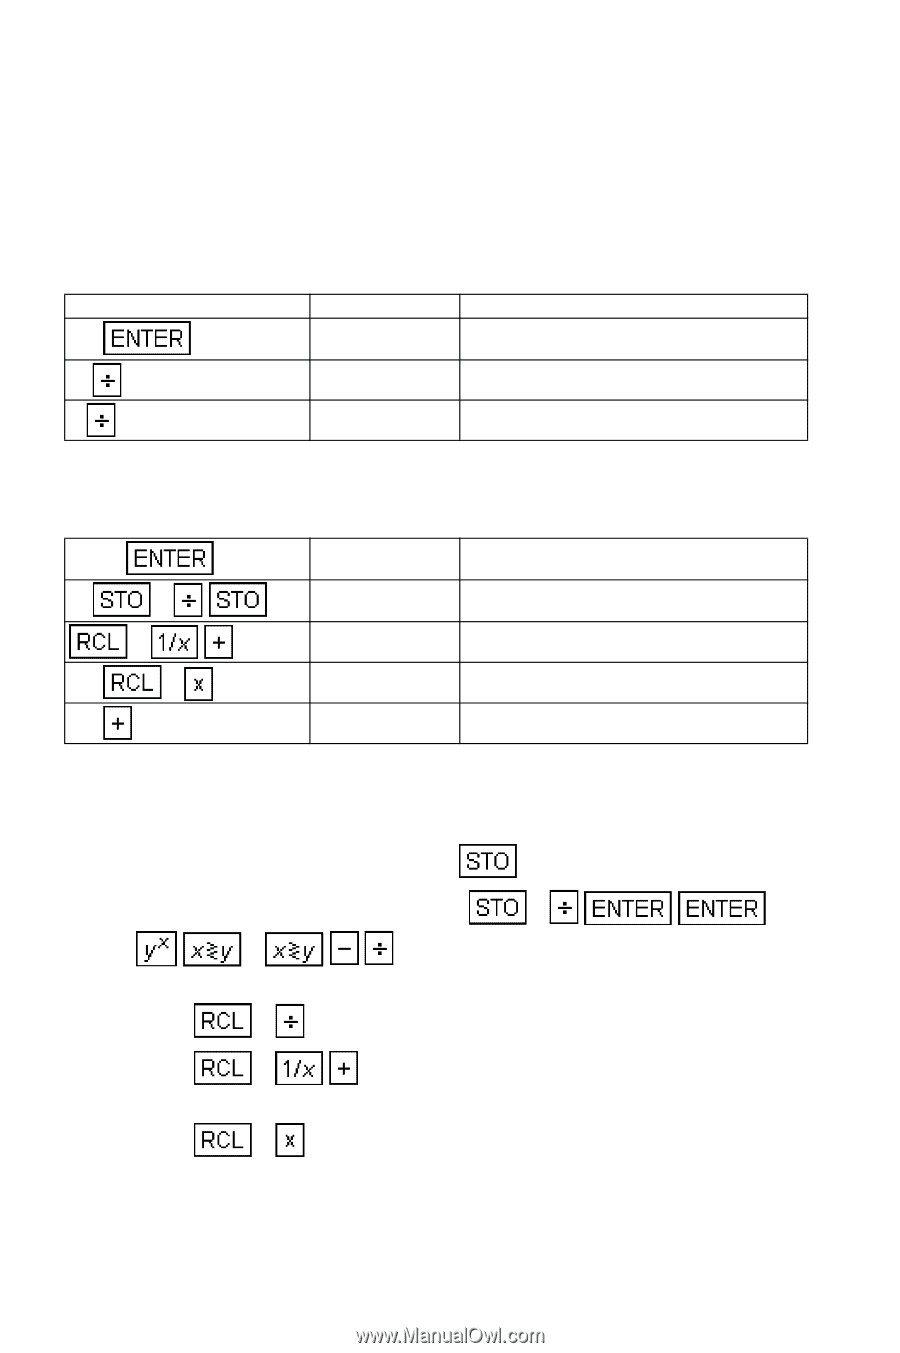
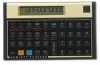
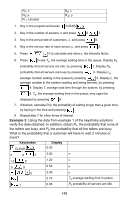
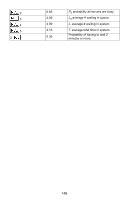
Richard E Trueman, "An Introduction to Quantitative Methods for Decision Making," Holt, Rinehart and Winston, New York, 1977 Example 1: Bank customers arrive at a bank on an average of 1.2 customers per minute. They join a common queue for three tellers. Each teller completes a transaction at the rate of one customer every 2 minutes (0.5 customers per minute). What is the average waiting time in the queue? In the system? What is the average number of customers in the queue? In the system? Keystrokes 1.2 .5 3 Display 1.20 2.40 0.80 ρ, intensity factor. ρ / n From Table 12.2, page 512 of the reference, the mean waiting time as a multiple of mean service time for n = 3, ρ/n = 0.8 is 1.079. (Note S is used instead of n in the reference's notation). 1.079 1.08 .5 1 2 2.16 Average wait in queue (min). 1 4.16 Average wait in system (min). 1.2 2 2.59 Average queue length. 2.4 4.99 Average # of customers in system. If the number of servers is limited to one, with other conditions remaining the same (unlimited queue, Poisson arrival, exponential service), the average queue length can be readily calculated without reference to tables: 1. Key in the arrival rate, λ, and press 1. 2. Key in the service rate, µ, and press 2 2 1 to calculate the average number of customers waiting in queue at any one time. 3. Press 1 to calculate the average waiting time. 4. Press 2 to calculate the average total time the customer spends in the system. 5. Press 1 to calculate the average number of customers in the system. Example 2: A small grocery store has but a single check-out counter. Customers arrive at a rate of 1 every 2 minutes (λ = .5) and, on the average, customers can be checked out at a rate of .9 per minute (µ). 144
-
 1
1 -
2
-
3
-
4
-
5
-
6
-
7
-
8
-
9
-
10
-
11
-
12
-
13
-
14
-
15
-
16
-
17
-
18
-
19
-
20
-
21
-
22
-
23
-
24
-
25
-
26
-
27
-
28
-
29
-
30
-
31
-
32
-
33
-
34
-
35
-
36
-
37
-
38
-
39
-
40
-
41
-
42
-
43
-
44
-
45
-
46
-
47
-
48
-
49
-
50
-
51
-
52
-
53
-
54
-
55
-
56
-
57
-
58
-
59
-
60
-
61
-
62
-
63
-
64
-
65
-
66
-
67
-
68
-
69
-
70
-
71
-
72
-
73
-
74
-
75
-
76
-
77
-
78
-
79
-
80
-
81
-
82
-
83
-
84
-
85
-
86
-
87
-
88
-
89
-
90
-
91
-
92
-
93
-
94
-
95
-
96
-
97
-
98
-
99
-
100
-
101
-
102
-
103
-
104
-
105
-
106
-
107
-
108
-
109
-
110
-
111
-
112
-
113
-
114
-
115
-
116
-
117
-
118
-
119
-
120
-
121
-
122
-
123
-
124
-
125
-
126
-
127
-
128
-
129
-
130
-
131
-
132
-
133
-
134
-
135
-
136
-
137
-
138
-
139
-
 140
140 -
 141
141 -
 142
142 -
 143
143 -
 144
144 -
 145
145 -
 146
146 -
 147
147 -
 148
148 -
 149
149 -
 150
150 -
151
-
152
-
153
-
154
-
155
-
156
-
157
-
158
-
159
-
160
-
161
-
162
-
163
-
164
-
165
 |
 |