Adobe 22011292 User Guide - Page 115
Frequency Graph, Smooth Wave, Spline Curves
 |
UPC - 883919139081
View all Adobe 22011292 manuals
Add to My Manuals
Save this manual to your list of manuals |
Page 115 highlights
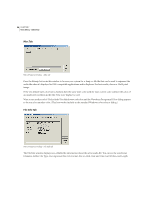
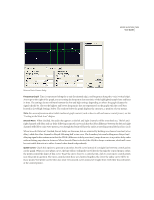
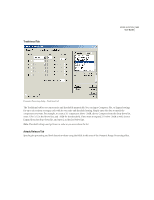
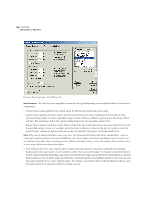
ADOBE AUDITION 101 User Guide Binaural Auto-Panner dialog Frequency Graph Time is represented along the x-axis (horizontal edge), and frequency along the y-axis (vertical edge). As you go to the right of the graph, you are setting the frequency characteristics of the highlighted sample later and later in time. The settings chosen will vary between the low and high settings depending on where the graph dictates the signals should be. Choose the highest and lowest frequencies that are represented on the graph with the scroll bars located in Low/High Settings, below. The readout below the graph displays the current x, y position of your mouse. Note: For more information about Adobe Audition's graph controls (such as how to add and remove control points), see the "Looking at the Work Area" chapter. Smooth Wave When checked, the audio that appears at the left and right channels will be smoothed out. The left and right channels will delay and un-delay following a smooth curve such that the delay difference between the left and right channels will follow a sine wave pattern, even though the brain will hear the audio as traveling around the head in a circle. When Smooth Wave isn't checked, the net delays are the same, but are achieved by holding one channel constant (at no delay) while the other channel is delayed following half a sine wave. The boundary between holding non-delayed and delaying signal is discontinuous in that the dD/dt (difference in delay over time) jumps from zero to a positive delay value without hitting any values in-between. When Smooth Wave is checked, the dD/dt is always continuous, which will cause less noticeable distortion in either channel when heard independently. Spline Curves Check this option to generate a smoother, best fit curve instead of a straight line between control points on the graph. When you use spline curves, the line will not ordinarily travel directly through the control points; rather, the points control the shape of this curve. To get the curve closer to a control point, click to create more control points near the point in question. The more control points there are clustered together, the closer the spline curve will be to those points. Use Spline Curves when you want very smooth curves instead of straight lines (with their discontinuities at the control points).
-
 1
1 -
2
-
3
-
4
-
5
-
6
-
7
-
8
-
9
-
10
-
11
-
12
-
13
-
14
-
15
-
16
-
17
-
18
-
19
-
20
-
21
-
22
-
23
-
24
-
25
-
26
-
27
-
28
-
29
-
30
-
31
-
32
-
33
-
34
-
35
-
36
-
37
-
38
-
39
-
40
-
41
-
42
-
43
-
44
-
45
-
46
-
47
-
48
-
49
-
50
-
51
-
52
-
53
-
54
-
55
-
56
-
57
-
58
-
59
-
60
-
61
-
62
-
63
-
64
-
65
-
66
-
67
-
68
-
69
-
70
-
71
-
72
-
73
-
74
-
75
-
76
-
77
-
78
-
79
-
80
-
81
-
82
-
83
-
84
-
85
-
86
-
87
-
88
-
89
-
90
-
91
-
92
-
93
-
94
-
95
-
96
-
97
-
98
-
99
-
100
-
101
-
102
-
103
-
104
-
105
-
106
-
107
-
108
-
109
-
 110
110 -
 111
111 -
 112
112 -
 113
113 -
 114
114 -
 115
115 -
 116
116 -
 117
117 -
 118
118 -
 119
119 -
 120
120 -
121
-
122
-
123
-
124
-
125
-
126
-
127
-
128
-
129
-
130
-
131
-
132
-
133
-
134
-
135
-
136
-
137
-
138
-
139
-
140
-
141
-
142
-
143
-
144
-
145
-
146
-
147
-
148
-
149
-
150
-
151
-
152
-
153
-
154
-
155
-
156
-
157
-
158
-
159
-
160
-
161
-
162
-
163
-
164
-
165
-
166
-
167
-
168
-
169
-
170
-
171
-
172
-
173
-
174
-
175
-
176
-
177
-
178
-
179
-
180
-
181
-
182
-
183
-
184
-
185
-
186
-
187
-
188
-
189
-
190
-
191
-
192
-
193
-
194
-
195
-
196
-
197
-
198
-
199
-
200
-
201
-
202
-
203
-
204
-
205
-
206
-
207
-
208
-
209
-
210
-
211
-
212
-
213
-
214
-
215
-
216
-
217
-
218
-
219
-
220
-
221
-
222
-
223
-
224
-
225
-
226
-
227
-
228
-
229
-
230
-
231
-
232
-
233
-
234
-
235
-
236
-
237
-
238
-
239
-
240
-
241
-
242
-
243
-
244
-
245
-
246
-
247
-
248
-
249
-
250
-
251
-
252
-
253
-
254
-
255
-
256
-
257
-
258
-
259
-
260
-
261
-
262
-
263
-
264
-
265
-
266
-
267
-
268
-
269
-
270
-
271
-
272
-
273
-
274
-
275
-
276
-
277
-
278
-
279
-
280
-
281
-
282
-
283
-
284
-
285
-
286
-
287
-
288
-
289
-
290
-
291
-
292
-
293
-
294
-
295
-
296
-
297
-
298
-
299
-
300
-
301
-
302
-
303
-
304
-
305
-
306
-
307
-
308
-
309
-
310
-
311
-
312
-
313
-
314
-
315
-
316
-
317
-
318
-
319
-
320
-
321
-
322
-
323
-
324
-
325
-
326
-
327
-
328
-
329
-
330
-
331
-
332
-
333
-
334
-
335
-
336
-
337
-
338
-
339
-
340
-
341
-
342
-
343
-
344
-
345
-
346
-
347
-
348
-
349
-
350
-
351
-
352
-
353
-
354
-
355
-
356
-
357
-
358
-
359
-
360
-
361
-
362
-
363
-
364
-
365
-
366
-
367
-
368
-
369
-
370
-
371
-
372
-
373
-
374
-
375
-
376
-
377
-
378
-
379
-
380
-
381
-
382
-
383
-
384
-
385
-
386
-
387
-
388
-
389
-
390
 |
 |
