HP Integrity Superdome SX1000 Installation (Smart Setup) Guide, Windows Server - Page 108
Network, Storage, Operating System, Information includes TCP information, including active connections
 |
View all HP Integrity Superdome SX1000 manuals
Add to My Manuals
Save this manual to your list of manuals |
Page 108 highlights
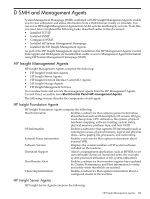
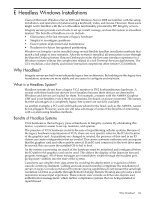
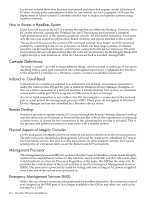
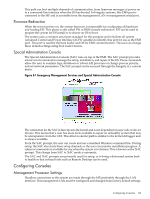
Network The NIC Management Agents display logical HP NICs that are configured on the system you are viewing. This can be a virtual NIC, single NIC, or teams of NICs. The information displayed depends on the type of NIC, and can include the following: • NIC controller information • NIC interface information • Ethernet statistics • Logical adapter information Storage The Storage section provides an overview of the selected server's mass storage subsystem. The mass storage controllers being used by the server are listed in the Navigation frame on the left side of the screen. The colored ball next to each controller indicates the status of that controller. NOTE: EMC, EVA, VA, and XP storage systems are not supported by WebAgents. The information displayed can include the following: • File system space used • SCSI disk information • SCSI controller information • Drive array controller information • Fibre Channel storage information • Fibre Channel tape controller information • IDE controller information • SAS host bus adapter information Operating System The Operating System category displays the following information: • Logical disks Information includes volume, free space, queue length, and disk busy time. • Memory Information includes available KBytes, pages/second, pages input/second, pages output/second, pages reads/second, cache bytes, cache faults, and pool non-paged bytes. • Network Information includes TCP information, including active connections, established connections, segments/second, segments retransmitted/second, and connection failures. Also includes controller information, including total bytes/second, packets/second, output queue length, packet errors, current bandwidth, bytes sent and received, and packets sent and received. • Physical disks Information includes volume name, queue length, and disk busy time. • Processes Information includes process name, number of active threads, private bytes, page file bytes, working set, page faults, % CPU time, and % privileged CPU time. • Processor Information includes CPU name, interrupts/second, % user CPU time, % privileged CPU time, % DPC time, % interrupt time, and % CPU time with thresholds supported. • Server Information includes system health (system up time, total threads, context switches/second, processor queue length, total processes, and % registry usage), security (access permission errors, access granted errors, server logon errors, and server sessions errored out), and server 108 SMH and Management Agents
-
 1
1 -
2
-
3
-
4
-
5
-
6
-
7
-
8
-
9
-
10
-
11
-
12
-
13
-
14
-
15
-
16
-
17
-
18
-
19
-
20
-
21
-
22
-
23
-
24
-
25
-
26
-
27
-
28
-
29
-
30
-
31
-
32
-
33
-
34
-
35
-
36
-
37
-
38
-
39
-
40
-
41
-
42
-
43
-
44
-
45
-
46
-
47
-
48
-
49
-
50
-
51
-
52
-
53
-
54
-
55
-
56
-
57
-
58
-
59
-
60
-
61
-
62
-
63
-
64
-
65
-
66
-
67
-
68
-
69
-
70
-
71
-
72
-
73
-
74
-
75
-
76
-
77
-
78
-
79
-
80
-
81
-
82
-
83
-
84
-
85
-
86
-
87
-
88
-
89
-
90
-
91
-
92
-
93
-
94
-
95
-
96
-
97
-
98
-
99
-
100
-
101
-
102
-
 103
103 -
 104
104 -
 105
105 -
 106
106 -
 107
107 -
 108
108 -
 109
109 -
 110
110 -
 111
111 -
 112
112 -
 113
113 -
114
 |
 |