ZyXEL P-335 Plus User Guide - Page 41
Table 9
 |
View all ZyXEL P-335 Plus manuals
Add to My Manuals
Save this manual to your list of manuals |
Page 41 highlights
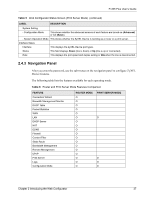
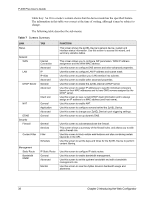
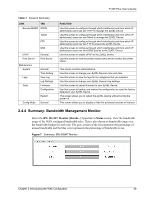
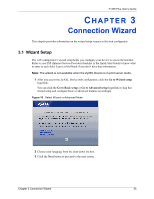
Figure 9 Summary: Packet Statistics P-335 Plus User's Guide The following table describes the labels in this screen. Table 9 Summary: Packet Statistics LABEL Port Status TxPkts RxPkts Collisions Tx B/s Rx B/s Up Time System Up Time Poll Interval(s) Set Interval Stop DESCRIPTION This is the ZyXEL Device's port type. For the LAN ports, this displays the port speed and duplex setting or Down when the line is disconnected. For the WAN port, it displays the port speed and duplex setting if you're using Ethernet encapsulation and Idle (line (ppp) idle), Dial (starting to trigger a call) and Drop (dropping a call) if you're using PPPoE or PPTP encapsulation. This field displays Down when the line is disconnected. This is the number of transmitted packets on this port. This is the number of received packets on this port. This is the number of collisions on this port. This displays the transmission speed in bytes per second on this port. This displays the reception speed in bytes per second on this port. This is the total amount of time the line has been up. This is the total time the ZyXEL Device has been on. Enter the time interval for refreshing statistics in this field. Click this button to apply the new poll interval you entered in the Poll Interval(s) field. Click Stop to stop refreshing statistics, click Stop. Chapter 2 Introducing the Web Configurator 41
-
 1
1 -
2
-
3
-
4
-
5
-
6
-
7
-
8
-
9
-
10
-
11
-
12
-
13
-
14
-
15
-
16
-
17
-
18
-
19
-
20
-
21
-
22
-
23
-
24
-
25
-
26
-
27
-
28
-
29
-
30
-
31
-
32
-
33
-
34
-
35
-
 36
36 -
 37
37 -
 38
38 -
 39
39 -
 40
40 -
 41
41 -
 42
42 -
 43
43 -
 44
44 -
 45
45 -
 46
46 -
47
-
48
-
49
-
50
-
51
-
52
-
53
-
54
-
55
-
56
-
57
-
58
-
59
-
60
-
61
-
62
-
63
-
64
-
65
-
66
-
67
-
68
-
69
-
70
-
71
-
72
-
73
-
74
-
75
-
76
-
77
-
78
-
79
-
80
-
81
-
82
-
83
-
84
-
85
-
86
-
87
-
88
-
89
-
90
-
91
-
92
-
93
-
94
-
95
-
96
-
97
-
98
-
99
-
100
-
101
-
102
-
103
-
104
-
105
-
106
-
107
-
108
-
109
-
110
-
111
-
112
-
113
-
114
-
115
-
116
-
117
-
118
-
119
-
120
-
121
-
122
-
123
-
124
-
125
-
126
-
127
-
128
-
129
-
130
-
131
-
132
-
133
-
134
-
135
-
136
-
137
-
138
-
139
-
140
-
141
-
142
-
143
-
144
-
145
-
146
-
147
-
148
-
149
-
150
-
151
-
152
-
153
-
154
-
155
-
156
-
157
-
158
-
159
-
160
-
161
-
162
-
163
-
164
-
165
-
166
-
167
-
168
-
169
-
170
-
171
-
172
-
173
-
174
-
175
-
176
-
177
-
178
-
179
-
180
-
181
-
182
-
183
-
184
-
185
-
186
-
187
-
188
-
189
-
190
-
191
-
192
-
193
-
194
-
195
-
196
-
197
-
198
-
199
-
200
-
201
-
202
-
203
-
204
-
205
-
206
-
207
-
208
-
209
-
210
-
211
-
212
-
213
-
214
-
215
-
216
-
217
-
218
-
219
-
220
-
221
-
222
-
223
-
224
-
225
-
226
-
227
-
228
-
229
-
230
-
231
-
232
-
233
-
234
-
235
-
236
-
237
-
238
-
239
-
240
-
241
-
242
-
243
-
244
-
245
-
246
-
247
-
248
 |
 |
