Konica Minolta bizhub PRESS C6000 IC-307 User Guide - Page 61
Calibration table Info Graph tab, Adding an entry to a calibration table, Separations, Output Density
 |
View all Konica Minolta bizhub PRESS C6000 manuals
Add to My Manuals
Save this manual to your list of manuals |
Page 61 highlights
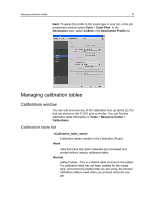
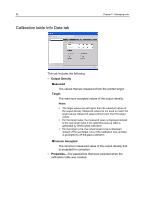
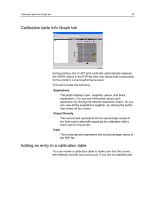
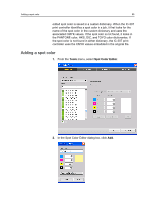
Calibration table Info Graph tab 53 Calibration table Info Graph tab During printing, the IC-307 print controller automatically replaces the CMYK values in the RTP file with new values that compensate for the printer's current performance level. This tab includes the following: Separations The graph displays cyan, magenta, yellow, and black separations. You can see information about each separation by clicking the desired separation button. Or you can view all the separations together, by clicking the button that shows all four colors. Output Density The vertical axis represents the dot percentage values of the final output data (after applying the calibration table) that is sent to the printer. Input The horizontal axis represents the dot percentage values of the RTP file. Adding an entry to a calibration table You can review a calibration table to make sure that the curves are relatively smooth and continuous. If you are not satisfied with
-
 1
1 -
2
-
3
-
4
-
5
-
6
-
7
-
8
-
9
-
10
-
11
-
12
-
13
-
14
-
15
-
16
-
17
-
18
-
19
-
20
-
21
-
22
-
23
-
24
-
25
-
26
-
27
-
28
-
29
-
30
-
31
-
32
-
33
-
34
-
35
-
36
-
37
-
38
-
39
-
40
-
41
-
42
-
43
-
44
-
45
-
46
-
47
-
48
-
49
-
50
-
51
-
52
-
53
-
54
-
55
-
 56
56 -
 57
57 -
 58
58 -
 59
59 -
 60
60 -
 61
61 -
 62
62 -
 63
63 -
 64
64 -
 65
65 -
 66
66 -
67
-
68
-
69
-
70
-
71
-
72
-
73
-
74
-
75
-
76
-
77
-
78
-
79
-
80
-
81
-
82
-
83
-
84
-
85
-
86
-
87
-
88
-
89
-
90
-
91
-
92
-
93
-
94
-
95
-
96
-
97
-
98
-
99
-
100
-
101
-
102
-
103
-
104
-
105
-
106
-
107
-
108
-
109
-
110
-
111
-
112
-
113
-
114
-
115
-
116
-
117
-
118
-
119
-
120
-
121
-
122
-
123
-
124
-
125
-
126
-
127
-
128
-
129
-
130
-
131
-
132
-
133
-
134
-
135
-
136
-
137
-
138
-
139
-
140
-
141
-
142
-
143
-
144
-
145
-
146
-
147
-
148
-
149
-
150
-
151
-
152
-
153
-
154
-
155
-
156
-
157
-
158
-
159
-
160
-
161
-
162
-
163
-
164
-
165
-
166
-
167
-
168
-
169
-
170
-
171
-
172
-
173
-
174
-
175
-
176
-
177
-
178
-
179
-
180
-
181
-
182
-
183
-
184
-
185
-
186
-
187
-
188
-
189
-
190
-
191
-
192
-
193
-
194
-
195
-
196
 |
 |
