HP StorageWorks 2/16V Brocade Fabric Watch Administrator's Guide - Supporting - Page 47
TABLE 11, Fabric Watch Concepts
 |
View all HP StorageWorks 2/16V manuals
Add to My Manuals
Save this manual to your list of manuals |
Page 47 highlights
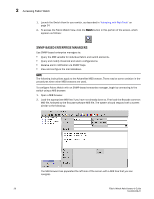
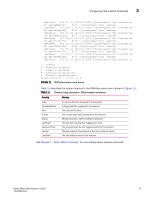
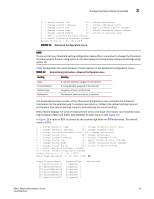
Configuring Fabric Watch thresholds 3 inBetween Fri Oct 21 14:21:01 2005 0 Percentage(%)/min Informative 217 eportRXPerf217 8/25 0 Percentage(%)/min enabled inBetween Fri Oct 21 14:21:07 2005 0 Percentage(%)/min Informative 218 eportRXPerf218 8/26 0 Percentage(%)/min enabled inBetween Fri Oct 21 14:21:07 2005 0 Percentage(%)/min Informative 219 eportRXPerf219 8/27 0 Percentage(%)/min enabled inBetween Fri Oct 21 14:21:07 2005 0 Percentage(%)/min Informative 220 eportRXPerf220 8/28 0 Percentage(%)/min enabled inBetween Fri Oct 21 14:21:07 2005 0 Percentage(%)/min Informative 221 eportRXPerf221 8/29 0 Percentage(%)/min enabled inBetween Fri Oct 21 14:21:07 2005 0 Percentage(%)/min Informative 222 eportRXPerf222 8/30 0 Percentage(%)/min enabled inBetween Fri Oct 21 14:21:07 2005 0 Percentage(%)/min Informative 223 eportRXPerf223 8/31 0 Percentage(%)/min enabled inBetween Fri Oct 21 14:21:07 2005 0 Percentage(%)/min Informative 1 : refresh 2 : disable a threshold 3 : enable a threshold 4 : advanced configuration 5 : return to previous page Select choice => : (1..5) [5] 1 FIGURE 11 RXPerformance area menu Table 11 describes the column headers in the RXPerformance menu (shown in Figure 11). TABLE 11 Element listing information - RXPerformance area menu Heading Meaning Index ThresholdName Port CurVal Status LastEvent LasteventTime LastVal LastState A numeric identifier assigned to the element A string identifier assigned to the element The user port number The current data value contained by the element Monitoring status, either enabled or disabled The last event setting that triggered an event. The timestamp of the last triggered event for the element The data value of the element at the time of the last event The last detected state of the element See Chapter 1, "Fabric Watch Concepts" for more details about classes and areas. Fabric Watch Administrator's Guide 31 53-0000438-01
-
 1
1 -
2
-
3
-
4
-
5
-
6
-
7
-
8
-
9
-
10
-
11
-
12
-
13
-
14
-
15
-
16
-
17
-
18
-
19
-
20
-
21
-
22
-
23
-
24
-
25
-
26
-
27
-
28
-
29
-
30
-
31
-
32
-
33
-
34
-
35
-
36
-
37
-
38
-
39
-
40
-
41
-
 42
42 -
 43
43 -
 44
44 -
 45
45 -
 46
46 -
 47
47 -
 48
48 -
 49
49 -
 50
50 -
 51
51 -
 52
52 -
53
-
54
-
55
-
56
-
57
-
58
-
59
-
60
-
61
-
62
-
63
-
64
-
65
-
66
-
67
-
68
-
69
-
70
-
71
-
72
-
73
-
74
-
75
-
76
-
77
-
78
-
79
-
80
-
81
-
82
-
83
-
84
-
85
-
86
-
87
-
88
-
89
-
90
-
91
-
92
-
93
-
94
-
95
-
96
-
97
-
98
-
99
-
100
-
101
-
102
 |
 |