HP StorageWorks 2/16V Brocade Fabric Watch Administrator's Guide - Supporting - Page 74
Types of Fabric Watch reports, TABLE 16
 |
View all HP StorageWorks 2/16V manuals
Add to My Manuals
Save this manual to your list of manuals |
Page 74 highlights
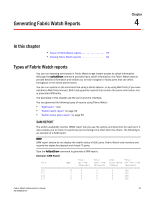
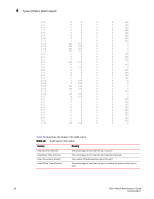
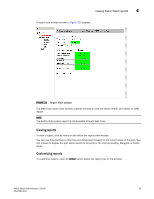
4 Types of Fabric Watch reports 1/4 1/5 1/6 1/7 1/8 1/9 1/10 1/11 1/12 1/13 1/14 1/15 2/0 2/1 2/2 2/3 2/4 2/5 2/6 2/7 2/8 2/9 2/10 2/11 2/12 2/13 2/14 2/15 3/0 3/1 3/2 3/3 3/4 3/5 3/6 3/7 3/8 3/9 3/10 . . . U 0 0 0 100 U 0 0 0 100 U 0 0 0 100 U 0 0 0 100 U 0 0 0 100 U 0 0 0 100 U 0 0 0 100 U 0 0 0 100 EX 100 0 0 0 EX 100 0 0 0 EX 100 0 0 0 EX 100 0 0 0 U 0 0 0 100 U 0 0 0 100 U 0 0 0 100 LB 100 0 0 0 U 0 0 0 100 LB 100 0 0 0 U 0 0 0 100 U 0 0 0 100 U 0 0 0 100 U 0 0 0 100 T 100 0 0 0 T 100 0 0 0 LB 100 0 0 0 LB 100 0 0 0 U 0 0 0 100 LB 100 0 0 0 T 100 0 0 0 U 0 0 0 100 U 0 0 0 100 U 0 0 0 100 U 0 0 0 100 U 0 0 0 100 U 0 0 0 100 U 0 0 0 100 U 0 0 0 100 U 0 0 0 100 VE 100 0 0 0 Table 16 describes the fields in the SAM report. TABLE 16 SAM report information Heading Meaning Total Up Time (Percent) Total Down Time (Percent) Down Occurrence (Count) Total Offline Time (Percent) The percentage of time that the port is active The percentage of time that the port experiences faults The number of faults experienced on the port The percentage of time that the port is inactive for reasons other than a fault. 58 Fabric Watch Administrator's Guide 53-0000438-01
-
 1
1 -
2
-
3
-
4
-
5
-
6
-
7
-
8
-
9
-
10
-
11
-
12
-
13
-
14
-
15
-
16
-
17
-
18
-
19
-
20
-
21
-
22
-
23
-
24
-
25
-
26
-
27
-
28
-
29
-
30
-
31
-
32
-
33
-
34
-
35
-
36
-
37
-
38
-
39
-
40
-
41
-
42
-
43
-
44
-
45
-
46
-
47
-
48
-
49
-
50
-
51
-
52
-
53
-
54
-
55
-
56
-
57
-
58
-
59
-
60
-
61
-
62
-
63
-
64
-
65
-
66
-
67
-
68
-
 69
69 -
 70
70 -
 71
71 -
 72
72 -
 73
73 -
 74
74 -
 75
75 -
 76
76 -
 77
77 -
 78
78 -
 79
79 -
80
-
81
-
82
-
83
-
84
-
85
-
86
-
87
-
88
-
89
-
90
-
91
-
92
-
93
-
94
-
95
-
96
-
97
-
98
-
99
-
100
-
101
-
102
 |
 |