HP StorageWorks 2/16V Brocade Fabric Watch Administrator's Guide - Supporting - Page 79
Viewing reports, Customizing reports, Report View window
 |
View all HP StorageWorks 2/16V manuals
Add to My Manuals
Save this manual to your list of manuals |
Page 79 highlights
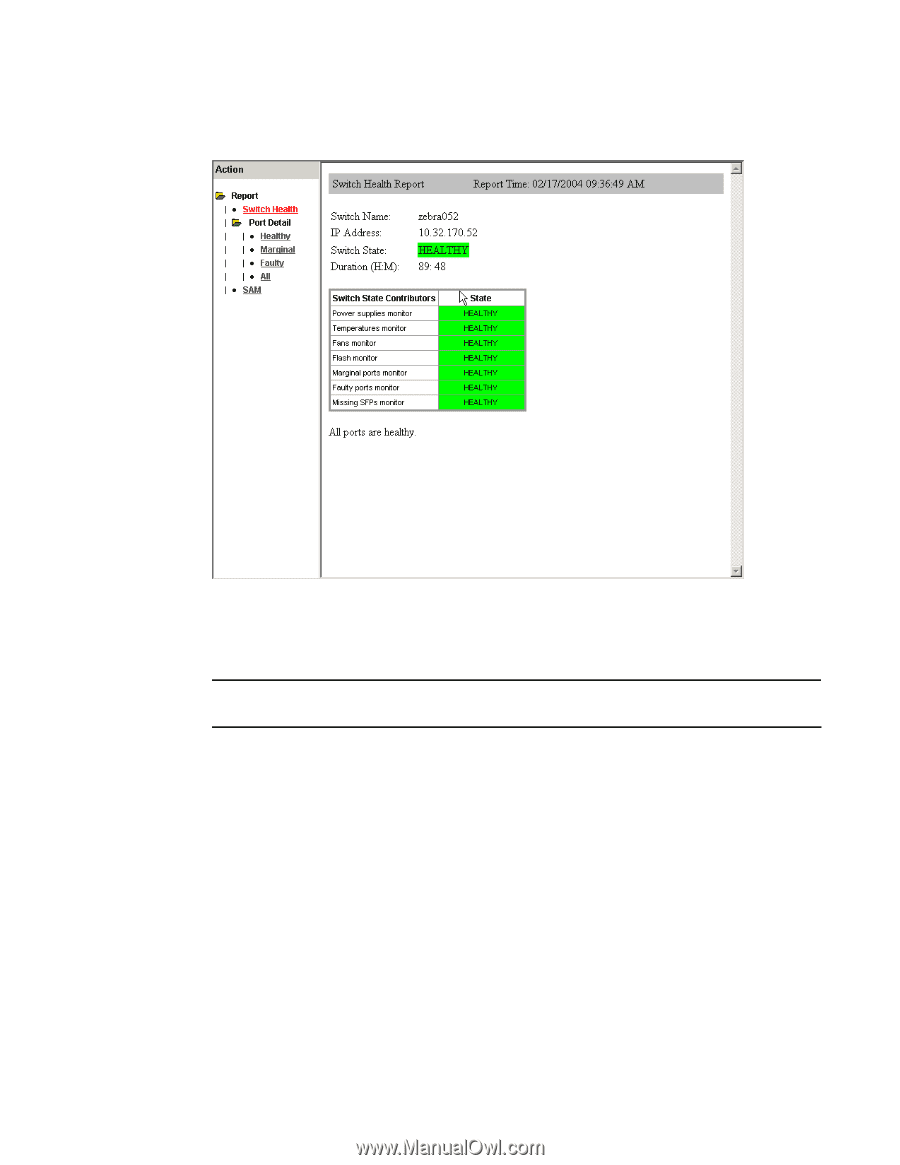
Viewing Fabric Watch reports 4 A report view window (shown in Figure 32) displays. FIGURE 32 Report View window The Web Tools report view window contains choices to view the switch health, port detail, or SAM report. NOTE The switch status policy report is not available through Web Tools. Viewing reports To view a report, click its name on the left of the report view window. You can use this interface to filter the port detail report based on the current state of the port. You can choose to display the port detail report for all ports or for only the Healthy, Marginal, or Faulty ports. Customizing reports To customize reports, click the Action button above the report tree in the window. Fabric Watch Administrator's Guide 63 53-0000438-01
-
 1
1 -
2
-
3
-
4
-
5
-
6
-
7
-
8
-
9
-
10
-
11
-
12
-
13
-
14
-
15
-
16
-
17
-
18
-
19
-
20
-
21
-
22
-
23
-
24
-
25
-
26
-
27
-
28
-
29
-
30
-
31
-
32
-
33
-
34
-
35
-
36
-
37
-
38
-
39
-
40
-
41
-
42
-
43
-
44
-
45
-
46
-
47
-
48
-
49
-
50
-
51
-
52
-
53
-
54
-
55
-
56
-
57
-
58
-
59
-
60
-
61
-
62
-
63
-
64
-
65
-
66
-
67
-
68
-
69
-
70
-
71
-
72
-
73
-
 74
74 -
 75
75 -
 76
76 -
 77
77 -
 78
78 -
 79
79 -
 80
80 -
 81
81 -
 82
82 -
 83
83 -
 84
84 -
85
-
86
-
87
-
88
-
89
-
90
-
91
-
92
-
93
-
94
-
95
-
96
-
97
-
98
-
99
-
100
-
101
-
102
 |
 |
Fabric Watch Administrator’s Guide
63
53-0000438-01
Viewing Fabric Watch reports
4
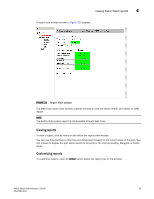
A report view window (shown in
Figure 32
) displays.
FIGURE 32
Report View window
The Web Tools report view window contains choices to view the switch health, port detail, or SAM
report.
NOTE
The switch status policy report is not available through Web Tools.
Viewing reports
To view a report, click its name on the left of the report view window.
You can use this interface to filter the port detail report based on the current state of the port. You
can choose to display the port detail report for all ports or for only the Healthy, Marginal, or Faulty
ports.
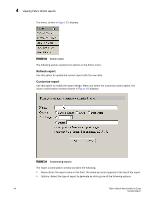
Customizing reports
To customize reports, click the
Action
button above the report tree in the window.