HP StorageWorks 2/16V Brocade Fabric Watch Administrator's Guide - Supporting - Page 48
Step 2: Con thresholds,
 |
View all HP StorageWorks 2/16V manuals
Add to My Manuals
Save this manual to your list of manuals |
Page 48 highlights
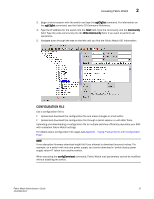
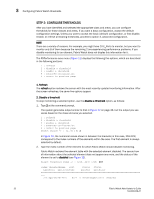
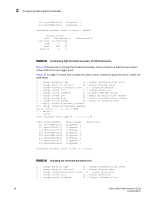
3 Configuring Fabric Watch thresholds STEP 2: CONFIGURE THRESHOLDS After you have identified and selected the appropriate class and areas, you can configure thresholds for those classes and areas. If you want a basic configuration, accept the default configuration settings. Unless you want to accept the basic (default) configuration, or first disable, enable, or refresh all existing thresholds, proceed to option 4, advanced configuration. NOTE There are a variety of reasons. For example, you might have 10 E_Ports to monitor, but you want to monitor only 8 of them because the remaining 2 are experiencing performance problems. If you disable monitoring for an element, Fabric Watch does not display this information for it. The RXPerformance area menu (Figure 11) displays the following five options, which are described in the following sections: 1 : refresh 2 : disable a threshold 3 : enable a threshold 4 : advanced configuration 5 : return to previous page 1. Refresh The refresh option redraws the screen with the most recently updated monitoring information. After the screen refreshes, the same five options appear. 2. Disable a threshold To stop monitoring a selected option, use the disable a threshold option, as follows: 1. Type 2 at the command prompt. The system generates output similar to that in Figure 12 on page 33, but the output you see varies based on the class and area you selected. 1 : refresh 2 : disable a threshold 3 : enable a threshold 4 : advanced configuration 5 : return to previous page Select choice => : (1..5) [5] 2 In Figure 12, the numerical values shown in between the brackets (in this case, 216-223) correspond to the index numbers of the elements within the area. The first element is always selected by default. 2. Type the index number of the element for which Fabric Watch should disable monitoring. Fabric Watch redraws the element table with the selected element disabled. The second row of information about the selected element does not appear any more, and the status of the element is set to disabled (see Figure 12). Select threshold index => : (216..223) [216] 218 Index ThresholdName Port CurVal Status LastEvent LasteventTime LastVal LastState === 216 eportRXPerf216 8/24 0 Percentage(%)/min enabled 32 Fabric Watch Administrator's Guide 53-0000438-01
-
 1
1 -
2
-
3
-
4
-
5
-
6
-
7
-
8
-
9
-
10
-
11
-
12
-
13
-
14
-
15
-
16
-
17
-
18
-
19
-
20
-
21
-
22
-
23
-
24
-
25
-
26
-
27
-
28
-
29
-
30
-
31
-
32
-
33
-
34
-
35
-
36
-
37
-
38
-
39
-
40
-
41
-
42
-
 43
43 -
 44
44 -
 45
45 -
 46
46 -
 47
47 -
 48
48 -
 49
49 -
 50
50 -
 51
51 -
 52
52 -
 53
53 -
54
-
55
-
56
-
57
-
58
-
59
-
60
-
61
-
62
-
63
-
64
-
65
-
66
-
67
-
68
-
69
-
70
-
71
-
72
-
73
-
74
-
75
-
76
-
77
-
78
-
79
-
80
-
81
-
82
-
83
-
84
-
85
-
86
-
87
-
88
-
89
-
90
-
91
-
92
-
93
-
94
-
95
-
96
-
97
-
98
-
99
-
100
-
101
-
102
 |
 |