HP StorageWorks 2/16V Brocade Fabric Watch Administrator's Guide - Supporting - Page 49
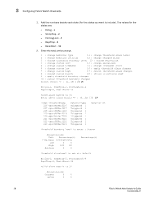
The numerical values shown in between the brackets in this case, 216-223 correspond
 |
View all HP StorageWorks 2/16V manuals
Add to My Manuals
Save this manual to your list of manuals |
Page 49 highlights
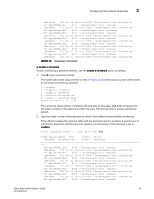
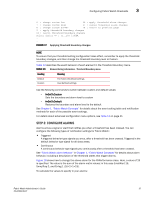
Configuring Fabric Watch thresholds 3 inBetween Fri Oct 21 14:21:01 2005 0 Percentage(%)/min Informative 217 eportRXPerf217 8/25 0 Percentage(%)/min enabled inBetween Fri Oct 21 14:21:07 2005 0 Percentage(%)/min Informative 218 eportRXPerf218 8/26 0 Percentage(%)/min disabled 219 eportRXPerf219 8/27 0 Percentage(%)/min enabled inBetween Fri Oct 21 14:21:07 2005 0 Percentage(%)/min Informative 220 eportRXPerf220 8/28 0 Percentage(%)/min enabled inBetween Fri Oct 21 14:21:07 2005 0 Percentage(%)/min Informative 221 eportRXPerf221 8/29 0 Percentage(%)/min enabled inBetween Fri Oct 21 14:21:07 2005 0 Percentage(%)/min Informative 222 eportRXPerf222 8/30 0 Percentage(%)/min enabled inBetween Fri Oct 21 14:21:07 2005 0 Percentage(%)/min Informative 223 eportRXPerf223 8/31 0 Percentage(%)/min enabled inBetween Fri Oct 21 14:21:07 2005 0 Percentage(%)/min Informative FIGURE 12 Disabling a threshold 3. Enable a threshold To start monitoring a selected element, use the enable a threshold option as follows: 1. Type 3 at the command prompt. The system generates output similar to that in Figure 13, but the output you see varies based on the class and area you selected. 1 : refresh 2 : disable a threshold 3 : enable a threshold 4 : advanced configuration 5 : return to previous page Select choice => : (1..5) 3 The numerical values shown in between the brackets (in this case, 216-223) correspond to the index numbers of the elements within the area. The first element is always selected by default. 2. Type the index number of the element for which Fabric Watch should enable monitoring. Fabric Watch redraws the element table with the selected element enabled. A second row of information about the selected element appears, and the status of the element is set to enabled. Select threshold index => : (216..223) [216] 218 Index ThresholdName Port CurVal Status LastEvent LasteventTime LastVal LastState === 216 eportRXPerf216 8/24 0 Percentage(%)/min enabled inBetween Fri Oct 21 14:21:01 2005 0 Percentage(%)/min Informative 217 eportRXPerf217 8/25 0 Percentage(%)/min enabled inBetween Fri Oct 21 14:21:07 2005 0 Percentage(%)/min Informative 218 eportRXPerf218 8/26 0 Percentage(%)/min enabled inBetween Fri Oct 21 14:21:07 2005 0 Percentage(%)/min Informative 219 eportRXPerf219 8/27 0 Percentage(%)/min enabled inBetween Fri Oct 21 14:21:07 2005 0 Percentage(%)/min Informative 220 eportRXPerf220 8/28 0 Percentage(%)/min enabled inBetween Fri Oct 21 14:21:07 2005 0 Percentage(%)/min Informative 221 eportRXPerf221 8/29 0 Percentage(%)/min enabled inBetween Fri Oct 21 14:21:07 2005 0 Percentage(%)/min Informative 222 eportRXPerf222 8/30 0 Percentage(%)/min enabled Fabric Watch Administrator's Guide 33 53-0000438-01
-
 1
1 -
2
-
3
-
4
-
5
-
6
-
7
-
8
-
9
-
10
-
11
-
12
-
13
-
14
-
15
-
16
-
17
-
18
-
19
-
20
-
21
-
22
-
23
-
24
-
25
-
26
-
27
-
28
-
29
-
30
-
31
-
32
-
33
-
34
-
35
-
36
-
37
-
38
-
39
-
40
-
41
-
42
-
43
-
 44
44 -
 45
45 -
 46
46 -
 47
47 -
 48
48 -
 49
49 -
 50
50 -
 51
51 -
 52
52 -
 53
53 -
 54
54 -
55
-
56
-
57
-
58
-
59
-
60
-
61
-
62
-
63
-
64
-
65
-
66
-
67
-
68
-
69
-
70
-
71
-
72
-
73
-
74
-
75
-
76
-
77
-
78
-
79
-
80
-
81
-
82
-
83
-
84
-
85
-
86
-
87
-
88
-
89
-
90
-
91
-
92
-
93
-
94
-
95
-
96
-
97
-
98
-
99
-
100
-
101
-
102
 |
 |