ZyXEL ISG50-PSTN User Guide - Page 202
Table 36, Label, Description
 |
View all ZyXEL ISG50-PSTN manuals
Add to My Manuals
Save this manual to your list of manuals |
Page 202 highlights
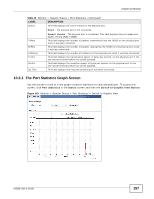
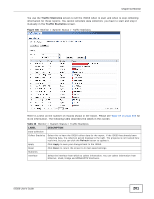
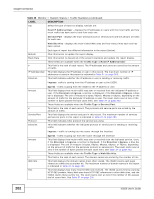
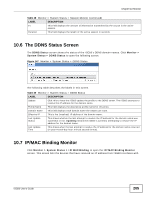
Chapter 10 Monitor Table 36 Monitor > System Status > Traffic Statistics (continued) LABEL Top DESCRIPTION Select the type of report to display. Choices are: Host IP Address/User - displays the IP addresses or users with the most traffic and how much traffic has been sent to and from each one. Service/Port - displays the most-used protocols or service ports and the amount of traffic for each one. Web Site Hits - displays the most-visited Web sites and how many times each one has been visited. Refresh Flush Data # IP Address/User Direction Each type of report has different information in the report (below). Click this button to update the report display. Click this button to discard all of the screen's statistics and update the report display. These fields are available when the Traffic Type is Host IP Address/User. This field is the rank of each record. The IP addresses and users are sorted by the amount of traffic. This field displays the IP address or user in this record. The maximum number of IP addresses or users in this report is indicated in Table 37 on page 203. This field indicates whether the IP address or user is sending or receiving traffic. Ingress- traffic is coming from the IP address or user to the ISG50. Amount # Service/Port Protocol Direction Egress - traffic is going from the ISG50 to the IP address or user. This field displays how much traffic was sent or received from the indicated IP address or user. If the Direction is Ingress, a red bar is displayed; if the Direction is Egress, a blue bar is displayed. The unit of measure is bytes, Kbytes, Mbytes or Gbytes, depending on the amount of traffic for the particular IP address or user. The count starts over at zero if the number of bytes passes the byte count limit. See Table 37 on page 203. These fields are available when the Traffic Type is Service/Port. This field is the rank of each record. The protocols and service ports are sorted by the amount of traffic. This field displays the service and port in this record. The maximum number of services and service ports in this report is indicated in Table 37 on page 203. This field indicates what protocol the service was using. This field indicates whether the indicated protocol or service port is sending or receiving traffic. Ingress - traffic is coming into the router through the interface Amount # Web Site Hits Egress - traffic is going out from the router through the interface This field displays how much traffic was sent or received from the indicated service / port. If the Direction is Ingress, a red bar is displayed; if the Direction is Egress, a blue bar is displayed. The unit of measure is bytes, Kbytes, Mbytes, Gbytes, or Tbytes, depending on the amount of traffic for the particular protocol or service port. The count starts over at zero if the number of bytes passes the byte count limit. See Table 37 on page 203. These fields are available when the Traffic Type is Web Site Hits. This field is the rank of each record. The domain names are sorted by the number of hits. This field displays the domain names most often visited. The ISG50 counts each page viewed on a Web site as another hit. The maximum number of domain names in this report is indicated in Table 37 on page 203. This field displays how many hits the Web site received. The ISG50 counts hits by counting HTTP GET packets. Many Web sites have HTTP GET references to other Web sites, and the ISG50 counts these as hits too. The count starts over at zero if the number of hits passes the hit count limit. See Table 37 on page 203. 202 ISG50 User's Guide
-
 1
1 -
2
-
3
-
4
-
5
-
6
-
7
-
8
-
9
-
10
-
11
-
12
-
13
-
14
-
15
-
16
-
17
-
18
-
19
-
20
-
21
-
22
-
23
-
24
-
25
-
26
-
27
-
28
-
29
-
30
-
31
-
32
-
33
-
34
-
35
-
36
-
37
-
38
-
39
-
40
-
41
-
42
-
43
-
44
-
45
-
46
-
47
-
48
-
49
-
50
-
51
-
52
-
53
-
54
-
55
-
56
-
57
-
58
-
59
-
60
-
61
-
62
-
63
-
64
-
65
-
66
-
67
-
68
-
69
-
70
-
71
-
72
-
73
-
74
-
75
-
76
-
77
-
78
-
79
-
80
-
81
-
82
-
83
-
84
-
85
-
86
-
87
-
88
-
89
-
90
-
91
-
92
-
93
-
94
-
95
-
96
-
97
-
98
-
99
-
100
-
101
-
102
-
103
-
104
-
105
-
106
-
107
-
108
-
109
-
110
-
111
-
112
-
113
-
114
-
115
-
116
-
117
-
118
-
119
-
120
-
121
-
122
-
123
-
124
-
125
-
126
-
127
-
128
-
129
-
130
-
131
-
132
-
133
-
134
-
135
-
136
-
137
-
138
-
139
-
140
-
141
-
142
-
143
-
144
-
145
-
146
-
147
-
148
-
149
-
150
-
151
-
152
-
153
-
154
-
155
-
156
-
157
-
158
-
159
-
160
-
161
-
162
-
163
-
164
-
165
-
166
-
167
-
168
-
169
-
170
-
171
-
172
-
173
-
174
-
175
-
176
-
177
-
178
-
179
-
180
-
181
-
182
-
183
-
184
-
185
-
186
-
187
-
188
-
189
-
190
-
191
-
192
-
193
-
194
-
195
-
196
-
 197
197 -
 198
198 -
 199
199 -
 200
200 -
 201
201 -
 202
202 -
 203
203 -
 204
204 -
 205
205 -
 206
206 -
 207
207 -
208
-
209
-
210
-
211
-
212
-
213
-
214
-
215
-
216
-
217
-
218
-
219
-
220
-
221
-
222
-
223
-
224
-
225
-
226
-
227
-
228
-
229
-
230
-
231
-
232
-
233
-
234
-
235
-
236
-
237
-
238
-
239
-
240
-
241
-
242
-
243
-
244
-
245
-
246
-
247
-
248
-
249
-
250
-
251
-
252
-
253
-
254
-
255
-
256
-
257
-
258
-
259
-
260
-
261
-
262
-
263
-
264
-
265
-
266
-
267
-
268
-
269
-
270
-
271
-
272
-
273
-
274
-
275
-
276
-
277
-
278
-
279
-
280
-
281
-
282
-
283
-
284
-
285
-
286
-
287
-
288
-
289
-
290
-
291
-
292
-
293
-
294
-
295
-
296
-
297
-
298
-
299
-
300
-
301
-
302
-
303
-
304
-
305
-
306
-
307
-
308
-
309
-
310
-
311
-
312
-
313
-
314
-
315
-
316
-
317
-
318
-
319
-
320
-
321
-
322
-
323
-
324
-
325
-
326
-
327
-
328
-
329
-
330
-
331
-
332
-
333
-
334
-
335
-
336
-
337
-
338
-
339
-
340
-
341
-
342
-
343
-
344
-
345
-
346
-
347
-
348
-
349
-
350
-
351
-
352
-
353
-
354
-
355
-
356
-
357
-
358
-
359
-
360
-
361
-
362
-
363
-
364
-
365
-
366
-
367
-
368
-
369
-
370
-
371
-
372
-
373
-
374
-
375
-
376
-
377
-
378
-
379
-
380
-
381
-
382
-
383
-
384
-
385
-
386
-
387
-
388
-
389
-
390
-
391
-
392
-
393
-
394
-
395
-
396
-
397
-
398
-
399
-
400
-
401
-
402
-
403
-
404
-
405
-
406
-
407
-
408
-
409
-
410
-
411
-
412
-
413
-
414
-
415
-
416
-
417
-
418
-
419
-
420
-
421
-
422
-
423
-
424
-
425
-
426
-
427
-
428
-
429
-
430
-
431
-
432
-
433
-
434
-
435
-
436
-
437
-
438
-
439
-
440
-
441
-
442
-
443
-
444
-
445
-
446
-
447
-
448
-
449
-
450
-
451
-
452
-
453
-
454
-
455
-
456
-
457
-
458
-
459
-
460
-
461
-
462
-
463
-
464
-
465
-
466
-
467
-
468
-
469
-
470
-
471
-
472
-
473
-
474
-
475
-
476
-
477
-
478
-
479
-
480
-
481
-
482
-
483
-
484
-
485
-
486
-
487
-
488
-
489
-
490
-
491
-
492
-
493
-
494
-
495
-
496
-
497
-
498
-
499
-
500
-
501
-
502
-
503
-
504
-
505
-
506
-
507
-
508
-
509
-
510
-
511
-
512
-
513
-
514
-
515
-
516
-
517
-
518
-
519
-
520
-
521
-
522
-
523
-
524
-
525
-
526
-
527
-
528
-
529
-
530
-
531
-
532
-
533
-
534
-
535
-
536
-
537
-
538
-
539
-
540
-
541
-
542
-
543
-
544
-
545
-
546
-
547
-
548
-
549
-
550
-
551
-
552
-
553
-
554
-
555
-
556
-
557
-
558
-
559
-
560
-
561
-
562
-
563
-
564
-
565
-
566
-
567
-
568
-
569
-
570
-
571
-
572
-
573
-
574
-
575
-
576
-
577
-
578
-
579
-
580
-
581
-
582
-
583
-
584
-
585
-
586
-
587
-
588
-
589
-
590
-
591
-
592
-
593
-
594
-
595
-
596
-
597
-
598
-
599
-
600
-
601
-
602
-
603
-
604
-
605
-
606
-
607
-
608
-
609
-
610
-
611
-
612
-
613
-
614
-
615
-
616
-
617
-
618
-
619
-
620
-
621
-
622
-
623
-
624
-
625
-
626
-
627
-
628
-
629
-
630
-
631
-
632
-
633
-
634
-
635
-
636
-
637
-
638
-
639
-
640
-
641
-
642
-
643
-
644
-
645
-
646
-
647
-
648
-
649
-
650
-
651
-
652
-
653
-
654
-
655
-
656
-
657
-
658
-
659
-
660
-
661
-
662
-
663
-
664
-
665
-
666
-
667
-
668
-
669
-
670
-
671
-
672
-
673
-
674
-
675
-
676
-
677
-
678
-
679
-
680
-
681
-
682
-
683
-
684
-
685
-
686
-
687
-
688
-
689
-
690
-
691
-
692
-
693
-
694
-
695
-
696
-
697
-
698
-
699
-
700
-
701
-
702
-
703
-
704
-
705
-
706
-
707
-
708
-
709
-
710
-
711
-
712
-
713
-
714
-
715
-
716
-
717
-
718
-
719
-
720
-
721
-
722
-
723
-
724
-
725
-
726
-
727
-
728
-
729
-
730
-
731
-
732
-
733
-
734
-
735
-
736
-
737
-
738
-
739
-
740
-
741
-
742
-
743
-
744
-
745
-
746
-
747
-
748
-
749
-
750
-
751
-
752
-
753
-
754
-
755
-
756
-
757
-
758
-
759
-
760
-
761
-
762
-
763
-
764
-
765
-
766
-
767
-
768
-
769
-
770
-
771
-
772
-
773
-
774
-
775
-
776
-
777
-
778
-
779
-
780
-
781
-
782
-
783
-
784
-
785
-
786
-
787
-
788
-
789
-
790
-
791
-
792
-
793
-
794
-
795
-
796
-
797
-
798
-
799
-
800
-
801
-
802
-
803
-
804
-
805
-
806
-
807
-
808
-
809
-
810
-
811
-
812
-
813
-
814
-
815
-
816
-
817
-
818
-
819
-
820
-
821
-
822
-
823
-
824
-
825
-
826
-
827
-
828
-
829
-
830
-
831
-
832
-
833
-
834
-
835
-
836
-
837
-
838
-
839
-
840
-
841
-
842
-
843
-
844
-
845
-
846
-
847
-
848
-
849
-
850
-
851
-
852
-
853
-
854
-
855
-
856
-
857
-
858
-
859
-
860
-
861
-
862
-
863
-
864
-
865
-
866
-
867
-
868
-
869
-
870
-
871
-
872
-
873
-
874
-
875
-
876
-
877
-
878
-
879
-
880
 |
 |