ZyXEL UAG715 User Guide - Page 79
Table 22, Label, Description
 |
View all ZyXEL UAG715 manuals
Add to My Manuals
Save this manual to your list of manuals |
Page 79 highlights
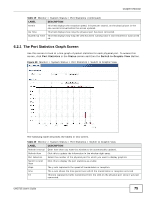
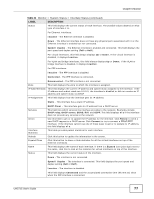
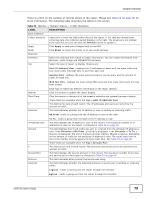
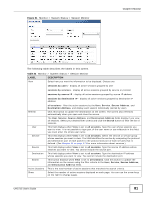
Chapter 6 Monitor There is a limit on the number of records shown in the report. Please see Table 23 on page 80 for more information. The following table describes the labels in this screen. Table 22 Monitor > System Status > Traffic Statistics LABEL Data Collection Collect Statistics Apply Reset Statistics Interface Top DESCRIPTION Select this to have the UAG collect data for the report. If the UAG has already been collecting data, the collection period displays to the right. The progress is not tracked here real-time, but you can click the Refresh button to update it. Click Apply to save your changes back to the UAG. Click Reset to return the screen to its last-saved settings. Select the interface from which to collect information. You can collect information from Ethernet, VLAN, bridge and PPPoE/PPTP interfaces. Select the type of report to display. Choices are: Host IP Address/User - displays the IP addresses or users with the most traffic and how much traffic has been sent to and from each one. Service/Port - displays the most-used protocols or service ports and the amount of traffic for each one. Web Site Hits - displays the most-visited Web sites and how many times each one has been visited. Refresh Flush Data # Direction Each type of report has different information in the report (below). Click this button to update the report display. Click this button to discard all of the screen's statistics and update the report display. These fields are available when the Top is Host IP Address/User. This field is the rank of each record. The IP addresses and users are sorted by the amount of traffic. This field indicates whether the IP address or user is sending or receiving traffic. RX From- traffic is coming from the IP address or user to the UAG. IP Address/User Amount # Service/Port Protocol Direction Tx To - traffic is going from the UAG to the IP address or user. This field displays the IP address or user in this record. The maximum number of IP addresses or users in this report is indicated in Table 23 on page 80. This field displays how much traffic was sent or received from the indicated IP address or user. If the Direction is RX From, a red bar is displayed; if the Direction is Tx To, a blue bar is displayed. The unit of measure is bytes, Kbytes, Mbytes or Gbytes, depending on the amount of traffic for the particular IP address or user. The count starts over at zero if the number of bytes passes the byte count limit. See Table 23 on page 80. These fields are available when the Top is Service/Port. This field is the rank of each record. The protocols and service ports are sorted by the amount of traffic. This field displays the service and port in this record. The maximum number of services and service ports in this report is indicated in Table 23 on page 80. This field indicates what protocol the service was using. This field indicates whether the indicated protocol or service port is sending or receiving traffic. Ingress - traffic is coming into the router through the interface Egress - traffic is going out from the router through the interface UAG715 User's Guide 79
-
 1
1 -
2
-
3
-
4
-
5
-
6
-
7
-
8
-
9
-
10
-
11
-
12
-
13
-
14
-
15
-
16
-
17
-
18
-
19
-
20
-
21
-
22
-
23
-
24
-
25
-
26
-
27
-
28
-
29
-
30
-
31
-
32
-
33
-
34
-
35
-
36
-
37
-
38
-
39
-
40
-
41
-
42
-
43
-
44
-
45
-
46
-
47
-
48
-
49
-
50
-
51
-
52
-
53
-
54
-
55
-
56
-
57
-
58
-
59
-
60
-
61
-
62
-
63
-
64
-
65
-
66
-
67
-
68
-
69
-
70
-
71
-
72
-
73
-
 74
74 -
 75
75 -
 76
76 -
 77
77 -
 78
78 -
 79
79 -
 80
80 -
 81
81 -
 82
82 -
 83
83 -
 84
84 -
85
-
86
-
87
-
88
-
89
-
90
-
91
-
92
-
93
-
94
-
95
-
96
-
97
-
98
-
99
-
100
-
101
-
102
-
103
-
104
-
105
-
106
-
107
-
108
-
109
-
110
-
111
-
112
-
113
-
114
-
115
-
116
-
117
-
118
-
119
-
120
-
121
-
122
-
123
-
124
-
125
-
126
-
127
-
128
-
129
-
130
-
131
-
132
-
133
-
134
-
135
-
136
-
137
-
138
-
139
-
140
-
141
-
142
-
143
-
144
-
145
-
146
-
147
-
148
-
149
-
150
-
151
-
152
-
153
-
154
-
155
-
156
-
157
-
158
-
159
-
160
-
161
-
162
-
163
-
164
-
165
-
166
-
167
-
168
-
169
-
170
-
171
-
172
-
173
-
174
-
175
-
176
-
177
-
178
-
179
-
180
-
181
-
182
-
183
-
184
-
185
-
186
-
187
-
188
-
189
-
190
-
191
-
192
-
193
-
194
-
195
-
196
-
197
-
198
-
199
-
200
-
201
-
202
-
203
-
204
-
205
-
206
-
207
-
208
-
209
-
210
-
211
-
212
-
213
-
214
-
215
-
216
-
217
-
218
-
219
-
220
-
221
-
222
-
223
-
224
-
225
-
226
-
227
-
228
-
229
-
230
-
231
-
232
-
233
-
234
-
235
-
236
-
237
-
238
-
239
-
240
-
241
-
242
-
243
-
244
-
245
-
246
-
247
-
248
-
249
-
250
-
251
-
252
-
253
-
254
-
255
-
256
-
257
-
258
-
259
-
260
-
261
-
262
-
263
-
264
-
265
-
266
-
267
-
268
-
269
-
270
-
271
-
272
-
273
-
274
-
275
-
276
-
277
-
278
-
279
-
280
-
281
-
282
-
283
-
284
-
285
-
286
-
287
-
288
-
289
-
290
-
291
-
292
-
293
-
294
-
295
-
296
-
297
-
298
-
299
-
300
-
301
-
302
-
303
-
304
-
305
-
306
-
307
-
308
-
309
-
310
-
311
-
312
-
313
-
314
-
315
-
316
-
317
-
318
-
319
-
320
-
321
-
322
-
323
-
324
-
325
-
326
-
327
-
328
-
329
-
330
-
331
-
332
-
333
-
334
-
335
-
336
-
337
-
338
-
339
-
340
-
341
-
342
-
343
-
344
-
345
-
346
-
347
-
348
-
349
-
350
-
351
-
352
-
353
-
354
-
355
-
356
-
357
-
358
-
359
-
360
-
361
-
362
-
363
-
364
-
365
-
366
-
367
-
368
-
369
-
370
-
371
-
372
-
373
-
374
-
375
-
376
-
377
-
378
-
379
-
380
-
381
-
382
-
383
-
384
-
385
-
386
-
387
-
388
-
389
-
390
-
391
-
392
-
393
-
394
-
395
-
396
-
397
-
398
-
399
-
400
-
401
-
402
-
403
-
404
-
405
-
406
-
407
-
408
-
409
-
410
-
411
-
412
-
413
-
414
-
415
-
416
-
417
-
418
-
419
-
420
-
421
-
422
-
423
-
424
-
425
-
426
-
427
-
428
-
429
-
430
-
431
-
432
-
433
-
434
-
435
-
436
-
437
-
438
-
439
-
440
-
441
-
442
-
443
-
444
-
445
-
446
-
447
-
448
-
449
-
450
-
451
-
452
-
453
-
454
-
455
-
456
-
457
-
458
-
459
-
460
-
461
-
462
-
463
-
464
-
465
-
466
-
467
-
468
-
469
-
470
-
471
-
472
-
473
-
474
-
475
-
476
-
477
-
478
-
479
-
480
-
481
-
482
-
483
-
484
-
485
-
486
-
487
-
488
-
489
-
490
-
491
-
492
-
493
-
494
-
495
-
496
-
497
-
498
-
499
-
500
-
501
-
502
-
503
-
504
-
505
-
506
-
507
-
508
-
509
-
510
-
511
-
512
-
513
-
514
-
515
-
516
-
517
-
518
-
519
-
520
-
521
-
522
-
523
-
524
-
525
-
526
-
527
-
528
-
529
-
530
-
531
-
532
-
533
-
534
-
535
-
536
-
537
-
538
-
539
-
540
-
541
-
542
 |
 |