HP 6125G HP 6125G & 6125G/XG Blade Switches Fundamentals Command Refer - Page 142
Table 20, Command output, exclude, display cpu-usage, Field, Description
 |
View all HP 6125G manuals
Add to My Manuals
Save this manual to your list of manuals |
Page 142 highlights
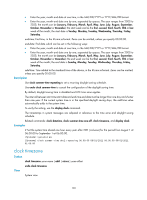
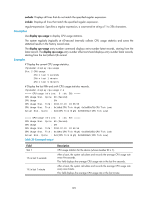
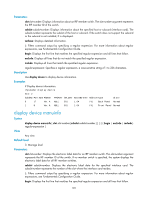
exclude: Displays all lines that do not match the specified regular expression. include: Displays all lines that match the specified regular expression. regular-expression: Specifies a regular expression, a case-sensitive string of 1 to 256 characters. Description Use display cpu-usage to display CPU usage statistics. The system regularly (typically at 60-second intervals) collects CPU usage statistics and saves the statistical results in the history record area. The display cpu-usage entry-number command displays entry-number latest records, starting from the latest record. The display cpu-usage entry-number offset command displays entry-number latest records, starting from the last (offset+1)th record. Examples # Display the current CPU usage statistics. display cpu-usage Slot 2 CPU usage: 3% in last 5 seconds 2% in last 1 minute 2% in last 5 minutes # Display the last fifth and sixth CPU usage statistics records. display cpu-usage 2 4 ===== CPU usage info (no: 0 idx: 58) ===== CPU Usage Stat. Cycle: 60 (Second) CPU Usage : 3% CPU Usage Stat. Time : 2010-07-10 10:56:55 CPU Usage Stat. Tick : 0x1d9d(CPU Tick High) 0x3a659a70(CPU Tick Low) Actual Stat. Cycle : 0x0(CPU Tick High) 0x95030517(CPU Tick Low) ===== CPU usage info (no: 1 idx: 57) ===== CPU Usage Stat. Cycle: 60 (Second) CPU Usage : 3% CPU Usage Stat. Time : 2010-07-10 10:55:55 CPU Usage Stat. Tick : 0x1d9c(CPU Tick High) 0xa50e5351(CPU Tick Low) Actual Stat. Cycle : 0x0(CPU Tick High) 0x950906af(CPU Tick Low) Table 20 Command output Field Slot 1 1% in last 5 seconds 1% in last 1 minute Description CPU usage statistics for the device (whose member ID is 1). After a boot, the system calculates and records the average CPU usage rate every five seconds. This field displays the average CPU usage rate in the last five seconds. After a boot, the system calculates and records the average CPU usage rate every one minute. This field displays the average CPU usage rate in the last minute. 135
-
 1
1 -
2
-
3
-
4
-
5
-
6
-
7
-
8
-
9
-
10
-
11
-
12
-
13
-
14
-
15
-
16
-
17
-
18
-
19
-
20
-
21
-
22
-
23
-
24
-
25
-
26
-
27
-
28
-
29
-
30
-
31
-
32
-
33
-
34
-
35
-
36
-
37
-
38
-
39
-
40
-
41
-
42
-
43
-
44
-
45
-
46
-
47
-
48
-
49
-
50
-
51
-
52
-
53
-
54
-
55
-
56
-
57
-
58
-
59
-
60
-
61
-
62
-
63
-
64
-
65
-
66
-
67
-
68
-
69
-
70
-
71
-
72
-
73
-
74
-
75
-
76
-
77
-
78
-
79
-
80
-
81
-
82
-
83
-
84
-
85
-
86
-
87
-
88
-
89
-
90
-
91
-
92
-
93
-
94
-
95
-
96
-
97
-
98
-
99
-
100
-
101
-
102
-
103
-
104
-
105
-
106
-
107
-
108
-
109
-
110
-
111
-
112
-
113
-
114
-
115
-
116
-
117
-
118
-
119
-
120
-
121
-
122
-
123
-
124
-
125
-
126
-
127
-
128
-
129
-
130
-
131
-
132
-
133
-
134
-
135
-
136
-
 137
137 -
 138
138 -
 139
139 -
 140
140 -
 141
141 -
 142
142 -
 143
143 -
 144
144 -
 145
145 -
 146
146 -
 147
147 -
148
-
149
-
150
-
151
-
152
-
153
-
154
-
155
-
156
-
157
-
158
-
159
-
160
-
161
-
162
-
163
-
164
-
165
-
166
-
167
-
168
-
169
-
170
-
171
-
172
-
173
-
174
-
175
-
176
-
177
-
178
-
179
-
180
 |
 |