HP StorageWorks 1606 Brocade Web Tools Administrator's Guide v6.3.0 (53-100134 - Page 151
Monitoring Performance, In this Performance Monitor overview
 |
View all HP StorageWorks 1606 manuals
Add to My Manuals
Save this manual to your list of manuals |
Page 151 highlights
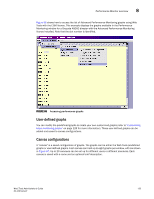
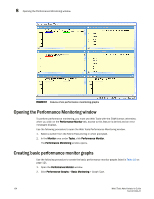
Monitoring Performance Chapter 8 In this chapter •Performance Monitor overview 119 •Opening the Performance Monitoring window 124 •Creating basic performance monitor graphs 124 •Customizing basic monitoring graphs 125 •Advanced performance monitoring graphs 127 •Tunnel and TCP performance monitoring graphs 130 •Saving graphs to a canvas 132 •Adding graphs to an existing canvas 132 •Printing graphs 133 •Modifying graphs 133 Performance Monitor overview The Web Tools Performance Monitoring window graphically displays throughput (in megabytes per second) for each port and for the entire switch. To perform performance monitoring, the EGM license must be enabled on the switch; otherwise, when you click on the Performance Monitor tab, access to this feature is denied and an error messages is displayed. NOTE The EGM license is required only for 8 Gbps platforms, such as the Brocade DCX and DCX-4S enterprise-class platforms, the Encryption Switch, the 300, 5300, and 5100 switches. For non-8 Gbps platforms, all functionalities are available without EGM license. The Basic Monitoring menu in Performance Monitor is standard in the Web Tools software. Any user logged into Web Tools with an associated role of zoneadmin or securityadmin cannot open Performance Monitor. The roles user, operator, and basicswitchadmin are allowed to perform basic monitoring tasks except save or display canvas operations in any Admin Domain context. Only users with the admin, switchadmin and fabricadmin roles associated with their login accounts are able to save or display a canvas. Use the Basic Monitoring option in the Performance Graphs window to do the following: • Create user-definable reports. • Display a performance canvas for application-level or fabric-level views. • Save persistent graphs across restarts (saves parameter data across restarts). The Advanced Monitoring menu in Performance Monitor is an optionally licensed feature. To utilize the Advanced Monitoring feature you must have a Performance Monitor license installed and you must log in using an account with an admin, switchadmin, or fabricadmin role. Web Tools Administrator's Guide 119 53-1001343-01
-
 1
1 -
2
-
3
-
4
-
5
-
6
-
7
-
8
-
9
-
10
-
11
-
12
-
13
-
14
-
15
-
16
-
17
-
18
-
19
-
20
-
21
-
22
-
23
-
24
-
25
-
26
-
27
-
28
-
29
-
30
-
31
-
32
-
33
-
34
-
35
-
36
-
37
-
38
-
39
-
40
-
41
-
42
-
43
-
44
-
45
-
46
-
47
-
48
-
49
-
50
-
51
-
52
-
53
-
54
-
55
-
56
-
57
-
58
-
59
-
60
-
61
-
62
-
63
-
64
-
65
-
66
-
67
-
68
-
69
-
70
-
71
-
72
-
73
-
74
-
75
-
76
-
77
-
78
-
79
-
80
-
81
-
82
-
83
-
84
-
85
-
86
-
87
-
88
-
89
-
90
-
91
-
92
-
93
-
94
-
95
-
96
-
97
-
98
-
99
-
100
-
101
-
102
-
103
-
104
-
105
-
106
-
107
-
108
-
109
-
110
-
111
-
112
-
113
-
114
-
115
-
116
-
117
-
118
-
119
-
120
-
121
-
122
-
123
-
124
-
125
-
126
-
127
-
128
-
129
-
130
-
131
-
132
-
133
-
134
-
135
-
136
-
137
-
138
-
139
-
140
-
141
-
142
-
143
-
144
-
145
-
 146
146 -
 147
147 -
 148
148 -
 149
149 -
 150
150 -
 151
151 -
 152
152 -
 153
153 -
 154
154 -
 155
155 -
 156
156 -
157
-
158
-
159
-
160
-
161
-
162
-
163
-
164
-
165
-
166
-
167
-
168
-
169
-
170
-
171
-
172
-
173
-
174
-
175
-
176
-
177
-
178
-
179
-
180
-
181
-
182
-
183
-
184
-
185
-
186
-
187
-
188
-
189
-
190
-
191
-
192
-
193
-
194
-
195
-
196
-
197
-
198
-
199
-
200
-
201
-
202
-
203
-
204
-
205
-
206
-
207
-
208
-
209
-
210
-
211
-
212
-
213
-
214
-
215
-
216
-
217
-
218
-
219
-
220
-
221
-
222
-
223
-
224
-
225
-
226
-
227
-
228
-
229
-
230
-
231
-
232
-
233
-
234
-
235
-
236
-
237
-
238
-
239
-
240
-
241
-
242
-
243
-
244
-
245
-
246
-
247
-
248
-
249
-
250
-
251
-
252
-
253
-
254
-
255
-
256
-
257
-
258
-
259
-
260
-
261
-
262
-
263
-
264
-
265
-
266
-
267
-
268
-
269
-
270
-
271
-
272
-
273
-
274
-
275
-
276
-
277
-
278
-
279
-
280
-
281
-
282
-
283
-
284
-
285
-
286
-
287
-
288
-
289
-
290
-
291
-
292
-
293
-
294
-
295
-
296
-
297
-
298
-
299
-
300
-
301
-
302
-
303
-
304
-
305
-
306
-
307
-
308
-
309
-
310
-
311
-
312
-
313
-
314
-
315
-
316
-
317
-
318
-
319
-
320
-
321
-
322
-
323
-
324
-
325
-
326
-
327
-
328
-
329
-
330
-
331
-
332
-
333
-
334
-
335
-
336
-
337
-
338
-
339
-
340
-
341
-
342
-
343
-
344
-
345
-
346
-
347
-
348
-
349
-
350
-
351
-
352
-
353
-
354
-
355
-
356
-
357
-
358
-
359
-
360
-
361
-
362
-
363
-
364
-
365
-
366
-
367
-
368
-
369
-
370
 |
 |
